Download
1 / 27
280 likes | 437 Views
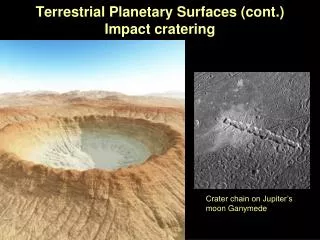
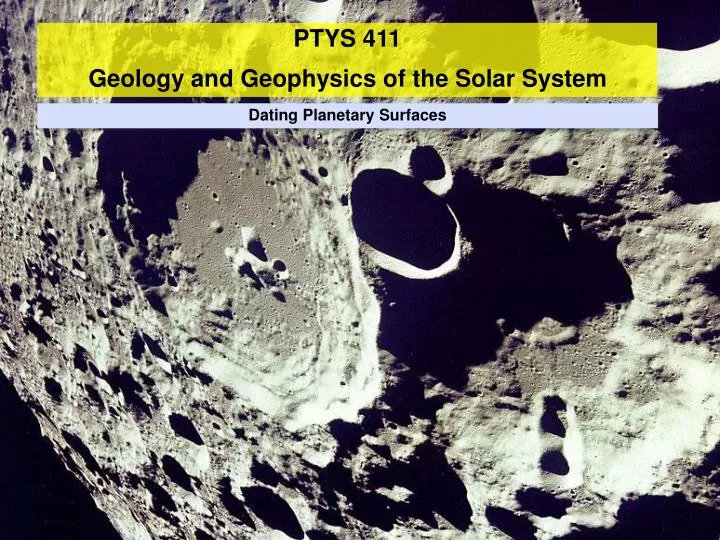
Dating Planetary Surfaces. Older surfaces have more craters Small craters are more frequent than large craters Relate crater counts to a surface age, if: Impact rate is constant Landscape is far from equilibrium i.e. new craters don ’ t erase old craters No other resurfacing processes

E N D
Older surfaces have more craters • Small craters are more frequent than large craters • Relate crater counts to a surface age, if: • Impact rate is constant • Landscape is far from equilibrium i.e. new craters don’t erase old craters • No other resurfacing processes • Target area all has one age • You have enough craters • Need fairly old or large areas • Techniques developed for lunar maria • Telescopic work established relative ages • Apollo sample provided absolute calibration Mercury – Young and Old
An ideal case… • Crater population is counted • Need some sensible criteria e.g. geologic unit, lava flow etc… • Tabulate craters in diameter bins • Bin size limits are some ratio e.g. 2½ • Size-frequency plot generated • In log-log space • Frequency is normalized to some area • Piecewise linear relationship: • Slope (64km<D, b ~ 2.2 • Slope (2km<D<64km), b ~ 1.8 • Slope (250m<D<2km), b ~ 3.8 • Primary vs. Secondary Branch • Vertical position related to age • These lines are isochrones • Actual data = production function - removal
There are at least 4 ways to represent crater count data • Bin spacing should be geometric, √2 is most common • Plots from craterstats (Michael & Neukum, EPSL, 2010) • Definitions from the “CRATER ANALYSIS TECHNIQUES WORKING GROUP” (Icarus, 37, 1979) Incremental Cumulative Relative Differential
Cumulative plots • Tends to mask deviations from the ideal • Not binned • Incremental plots • The ‘standard’ plot… Incremental Cumulative
Incremental plots with √2 diameter bin spacing is favored by Hartmann • Isochrons have become relatively standardized for Mars Hartmann, 2005
Cumulative plots • Differential plots Differential Cumulative
R-plots • Size-frequency plot with slope removed - Highlights differences from the ideal • Area of craters: • Rarely used Cumulative Relative (R-Plot)
R-plots reveal different populations of cratering bodies • Young surfaces are flat • close to a -2 slope in log(N) vs. log(D) • Older surfaces show a different impacting population • More on this later Strom et al., 2005
When a surface is saturated no more age information is added • Number of craters stops increasing • The whole premise of crater dating is that c (or k) increases linearly with time
Geometric saturation • Hexagonal packing allows craters to fill 90.5% of available area (Pf) • A mix of crater diameters allows Ns = 1.54 D-2 • Crater arrays separated by a factor of two in diameter For equal sized craters Log (N) Log (D)
Equilibrium saturation: • No surface ever reaches the geometrically saturated limit. • Saturation sets in long beforehand (typically a few % of the geometric value) • Mimas reaches 13% of geometric saturation – an extreme case • Craters below a certain diameter exhibit saturation • This diameter is higher for older terrain – 250m for lunar Maria • This saturation diameter increases with time
Multiple slope breaks • Summary of a classic crater size-frequency distribution • Typical size-frequency curve • Steep-branch for sizes <1-2 km • Saturation equilibrium for sizes <250m Sample of Mare Orientale
In general, it’s hardly ever as neat and tidy as the lunar mare. • Craters can get removed as fast as they arrive – an equilibrium population • production x lifetime = population • production & population known • Can find the crater lifetime… • Usually crater lifetime is a power-law of diameter: a Dx • If x=0, then the crater lifetime is the surface age i.e. all craters are preserved • If x=1, then crater lifetime is proportional to depth… e.g. constant infill rate
Viscous relaxation of icy topography can make craters undetectable • Maxwell time • Stress causes elastic deformation and creep • Time after which creep strain equals elastic strain • tM = εel / (Δεcreep/t) = η/μ • μ is the shear modulus (rigidity), η is the viscosity • On Earth • tM for rock >109 years • tM for ice ~ 100s sec • Ganymede ice is intermediate Pathare and Paige, 2005
Relaxed craters • Penepalimpset → Palimpset Viscous relaxation on the icy Galilean satellites Images by Paul Schenk Lunar and Planetary Institute
Secondary craters confuse the picture • Steep-branch of lunar production function caused controversy • Are these true secondaries or collisional fragments generated in space • Asteroid Gaspra • Also has steep-branch • Definitely lacks true secondaries • Case closed? Not really…
Analysis of Zunil by McEwen et al. • Modeling suggests this one crater can account for all craters a few 10’s of meters in size • They suggest most small craters on Mars should be secondaries • Secondary distribution • Lumpy in space and time • Can’t use these craters for dating a surface
Linking Crater Counts to Age • Moon is divided into two terrain types • Light-toned Terrae (highlands) – plagioclase feldspar • Dark-toned Mare – volcanic basalts • Maria have ~200 times fewer craters • Apollo and Luna missions • Sampled both terrains • Mare ages 3.1-3.8 Ga • Terrae ages all 3.8-4.0 Ga • Lunar meteorites • Confirm above ages are representative of most of the moon.
Crater counts had already established relative ages • Samples of the impact melt with geologic context allowed absolute dates to be connected to crater counts • Lunar cataclysm? • Highland crust solidified at ~4.45Ga • Impact melt from large basins cluster in age • Imbrium 3.85Ga • Nectaris 3.9-3.92 Ga
Before and after the late heavy bombardment • Cataclysm or tail-end of accretion? • Lunar mass favors cataclysm • Impact melt >4Ga is very scarce • Pb isotope record reset at ~3.8Ga • Cataclysm referred to as ‘Late Heavy Bombardment’ } weak
Origin of the late heavy bombardment projectiles • Convert crater size distribution to projectile size distribution • Using Pi scaling laws • Display both as R-plots to highlight structure • LHB – matches main-belt asteroids • Post LHB craters – match the near-Earth asteroid population • LHB caused by surge of asteroidal material entering the inner solar system • Migration of Jupiter can move orbital-resonances through the asteroid belt Strom et al., 2005
Lunar impact rates can be scaled to other planets • Must assume the same projectile population i.e. this doesn‘t work for the outer solar system where a different projectile population dominates • Two-step process – e.g. Mars • Rbolide is the ratio of projectile fluxes • Comes from dynamical studies ~2.6 (very uncertain) • Rcrater is the ratio of crater sizes formed by the same projectile • Impact energy ratio come from dynamical studies ~ 0.71 • Ratio of gravities = 2.3 • Rcrater ~ 0.75 Hartmann, 2005 Schmitt and Housen, 1987 Hartmann, 2005
The problem is that we can’t date martian materials in the lab… • But we can start to test these impact rates on Mars…. June 4th 2008 August 10th 2008
~300 impact events recognized so far • Crater sizes from a few meters to a few decameters • Effective diameter of clusters reconstructed from • Very biased and incomplete sample
Crater flux close to what we expect, but we’re not seeing all impacts… • Efficiency of atmospheric screening also not well known Daubar et al., 2013
Outer solar system chronology relies entirely on dynamical models • E.g. Titan shows a global ‘age’ of <1 Gyr Titan Cratering Neish and Lorenz, 2011