Download
1 / 16
170 likes | 313 Views
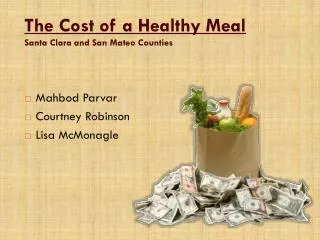
Cost of a Healthy Meal. Selena Pistoresi , Lisa McMonagle , & Tess Gordon. Special thanks to Bank of America Foundation for their financial support and commitment to the Cost of a Healthy Meal Study. U.S Food Expenditure. 2010 U.S. Population: 308,745,538

E N D
Cost of a Healthy Meal Selena Pistoresi, Lisa McMonagle, & Tess Gordon
Special thanks to Bank of America Foundation for their financial support and commitment to the Cost of a Healthy Meal Study
U.S Food Expenditure • 2010 U.S. Population: 308,745,538 • Aggregate Food Expenditure: $1.167 trillion Food Cost/Capita $3,780/year/365= $10.36/day Based on 2010 census data
Thrifty Food Plan Thrifty Food Plan: $5.37 per day Santa Clara County: $5.80 per day *USDA TFP 2013. http://www.cnpp.usda.gov/USDAFoodCost-Home.htm *8% higher food costs in the County according to Feeding America’s “Map the Meal Gap 2011”
Research Team • FAI Research Assistants • Tess Gordon, Lisa McMonagle, Selena Pistoresi, Courtney Robinson, & Alex Fryé • Internship Program • 16 interns over the summer in two separate sessions • Conducted and analyzed 20 interviews each
Study Total Sites Visited: 31 Interviews Conducted: 704
Research Process Step 1: Conduct Interview at SHFB Site Part 1: Basic Information Part 2: 24-hour Dietary Recall
Research Process cont’d Step 2: Price food items at grocery stores and calculate food costs • Go to specific grocery store closest to interview site Step 3: Analyze data • Enter food intake into Diet Analysis software • Enter data into Access database
Findings Continued 49% of our sample eat for under $5.37/day 55% of our sample eat for under $5.80/day Average: $6.00/day
Conclusions and Implications • 704 interviews collected • Goal: To complete the database (800 interviews) by June 2014 • 49% of our sample can acquire adequate nutrition on the current Thrifty Food Plan suggestion ($5.37/day) • Regional and cultural food cost consideration • Continue GIS and publish findings