Download
1 / 41
420 likes | 659 Views
Benefits, Drawbacks, and Pitfalls of z-Score Weighting. Joel P. Wiesen, Ph.D. wiesen@appliedpersonnelresearch.com 30th Annual IPMAAC Conference Las Vegas, NV 6/27/06. Combining Unlike Scores. Classic problem Covered in introductory statistics courses - z-score method recommended

E N D
Benefits, Drawbacks, and Pitfalls of z-Score Weighting Joel P. Wiesen, Ph.D. wiesen@appliedpersonnelresearch.com 30th Annual IPMAAC Conference Las Vegas, NV 6/27/06
Combining Unlike Scores • Classic problem • Covered in introductory statistics courses- z-score method recommended • Theoretical pros and cons • Practical pros and cons • Pitfalls Wiesen (2006), IPMAAC Conference
Why Calculate z-Scores? • To compare scores on two unlike scales- Conscientiousness- Physical performance test • To combine scores on two unlike scales- Compute weighted average Wiesen (2006), IPMAAC Conference
Example 1: Firefighter • Physical Performance Test: Range: 0 to 600- Mean = 450- S.D. = 60 • Conscientiousness: Range: 0 to 40- Mean = 20- S.D. = 12 Wiesen (2006), IPMAAC Conference
Problem with Simple Mean • Physical Performance Test will dominate- S.D. of 60 much greater than S.D. of 12 Wiesen (2006), IPMAAC Conference
Typical Solution • Convert to a common metric- z-scores- Percentiles- Ranks • z-scores have good statistical properties- Easy to do statistical tests- Commonly used Wiesen (2006), IPMAAC Conference
Percentiles and Ranks • Problem: Non-linear relationships to scores • Near the mean- a small change in test score results in a large change in rank or percentile • At the extremes of the distribution - a large change in test score results in a small change in rank or percentile Wiesen (2006), IPMAAC Conference
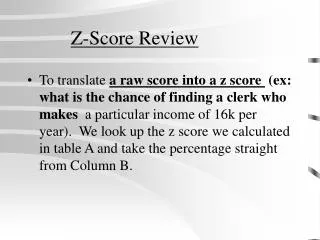
How to Calculate a z-Score • Step 1. Compute the mean • Step 2. Compute the standard deviation • Step 3. Compute the z-score Wiesen (2006), IPMAAC Conference
Potential Problems with z-Scores • Lose meaningfulness of raw scores- Raw score values may have meaning • Lose meaning of standard deviations • Magnify small differences • Need interval data • Confuse applicants Wiesen (2006), IPMAAC Conference
Meaningfulness of Raw Scores • PPT: Good raw score for PPT is 400- Corresponds to a z-score of -.83 (400-450)/60 = -50/60 = -.83 • Conscientiousness: Good score unknown- Mean is zero- Assume a good raw score is 32- Corresponds to a z-score of 1.0 Wiesen (2006), IPMAAC Conference
Example 1: Firefighter • Physical Performance Test: Range: 0 to 600- Mean = 450- S.D. = 60 • Conscientiousness: Range: 0 to 40- Mean = 20- S.D. = 12 Wiesen (2006), IPMAAC Conference
z-Score, Raw Score Discrepancy Wiesen (2006), IPMAAC Conference
Lost the Meaning in Raw Scores • Good score on PPT equates to z of -.83 • Good score on conscientiousness equates to z of 1 • Déjà vu all over again Wiesen (2006), IPMAAC Conference
S.D.s May Be Distorted • Candidates may preselect themselves • S.D. on PPT for the whole population may be 200, not the 60 as observed • Magnify small differences Wiesen (2006), IPMAAC Conference
Magnify Small Differences • Restricted range on one measure • Restriction may be unexpected Wiesen (2006), IPMAAC Conference
Example 2: Sergeant • Written test for SOPs: Range of 95 to 100 - Mean = 98- S.D. = 1 • Simulation for interpersonal: Range of 0 to 60- Mean = 30- S.D. = 20 Wiesen (2006), IPMAAC Conference
Magnify Small Differences Wiesen (2006), IPMAAC Conference
Possible Interpretations • All candidates know the SOPs- Little variability in written scores • Wide range of interpersonal ability- Not tested before on interpersonal ability Wiesen (2006), IPMAAC Conference
Problem • Written test has unintended weight- 1 point on written has great weight • Candidate B is higher than A, even though:- 15 points lower on simulation score- only 1 point higher on written score • Written test drives the average Wiesen (2006), IPMAAC Conference
Unintended Weights • Déjà vu all over again Wiesen (2006), IPMAAC Conference
Need Interval Data • Linear transformations require interval data • Some of our data may not be interval level- rank order of candidates • Example of interval level data- percent correct Wiesen (2006), IPMAAC Conference
Applicant Confusion • Applicant confusion is a serious matter • Applicants are not familiar with z-scores • z-scores do not have an intuitive passing point • z-scores do not have an intuitive maximum score Wiesen (2006), IPMAAC Conference
Other Approaches to Scaling • Rely on SMEs • Other transformations- More meaningful • Weight by reliability • Weight by validity (if known) • Use percent correct Wiesen (2006), IPMAAC Conference
Rely on SMEs • Avoid different scales • Identify passing points in all scales • Have SMEs use 0 to 100 rating scale- Define 70 to indicate passing • Anchor other points on scale- e.g., 80 = good Wiesen (2006), IPMAAC Conference
Meaningful Transformations • Use information in the scales- Combine scales using passing points Wiesen (2006), IPMAAC Conference
Example 3: Equate using Pass Points • Test 1: passing point of 70, max of 100 • Test 2: passing point of 50, max of 70 • Do a linear transformation Wiesen (2006), IPMAAC Conference
Linear Transformation • A line is defined by two points • Use pass score and maximum to define line • Use equation for a line y = ax+b • Assumes interval level data Wiesen (2006), IPMAAC Conference
Example 3: Calculations • Call Test 1 y, and call Test 2 x • Substitute into y = ax + b • At the passing score we get:70 = a50 + b • At maximum score we get:100 = a70 + b • Solving we get a = 1.5 and b = -5 Wiesen (2006), IPMAAC Conference
Transformation Calculations • We can convert Test 2 scores to a scale somewhat equivalent to Test 1 using this formula:y = 1.5x -5 • So, a score of 60 on Test 2 transforms to a score of 85y = (1.5) 60 - 5 = 90 - 5 = 85 Wiesen (2006), IPMAAC Conference
Weight by Reliability or Validity • Reliability- Higher weight for the test scores you trust • Validity- Higher weight for more job-related test Wiesen (2006), IPMAAC Conference
Use Percent Correct • Simply calculate percent of total possible • Pros:- Easy to calculate- Easy to explain • Cons:- May not give the intended weights Wiesen (2006), IPMAAC Conference
Pitfalls of z-Score Weighting • Applicant confusion • Setting weights before collecting data Wiesen (2006), IPMAAC Conference
Addressing Applicant Confusion • Transform z to another scale • SAT scale - Mean = 500- S.D. = 100 • IQ scale- Mean = 100- S.D. = 16 Wiesen (2006), IPMAAC Conference
How to Convert z-Scores • SAT scale is practical- Convert mean to 500- Convert S.D. to 100 • Use y = ax + ba = 100 and b = 500y = 100 x + 500 • z score of -.5 becomes a score of 450 Wiesen (2006), IPMAAC Conference
Setting Weights Without Data • Examination announcements often specify grading • Problematic to rely on “pilot” data for mean and S.D.- Sampling error with small samples- Pilot group may differ from applicants • Multiple hurdle exams yield restricted samples after the first hurdle, if correlated Wiesen (2006), IPMAAC Conference
Goals in Combining Scales • Make the scales more equal in meaning before combining scores from the scales • Strive for comparability in:- Units of scales- S.D. of scales- Meaning of scales Wiesen (2006), IPMAAC Conference
Other Thoughts • Should we weight scores on test areas within our M/C tests?- reasoning- math Wiesen (2006), IPMAAC Conference
Quotes from Guion • “A weighting method should be based on rational, theoretical grounds rather than on computations alone.” • “Often psychometric and statistical assumptions are not met in applied settings; it is not wise to take excessive pride in an impressive weighting system.”- (Guion, 1998, page 348) Wiesen (2006), IPMAAC Conference
Summary • z-score pros:- easy to compute- easy to assign weights- standard method • z-score cons:- risk losing information- risk unintended weights- risk confusing candidates Wiesen (2006), IPMAAC Conference
Final Thoughts • z-score transformations have their place • Use all transformations with care • Use meaningful transformations when possible • Use z-score when no intrinsic meaning to scales Copies of this presentation are available at: http://appliedpersonnelresearch.com/pubs.html Wiesen (2006), IPMAAC Conference
References • Guion, R.M. (1998) Assessment, Measurement, and Prediction for Personnel Decisions. Mahwah, New Jersey: Lawrence Erlbaum Associates, Publishers. Wiesen (2006), IPMAAC Conference