Download
1 / 43
430 likes | 539 Views
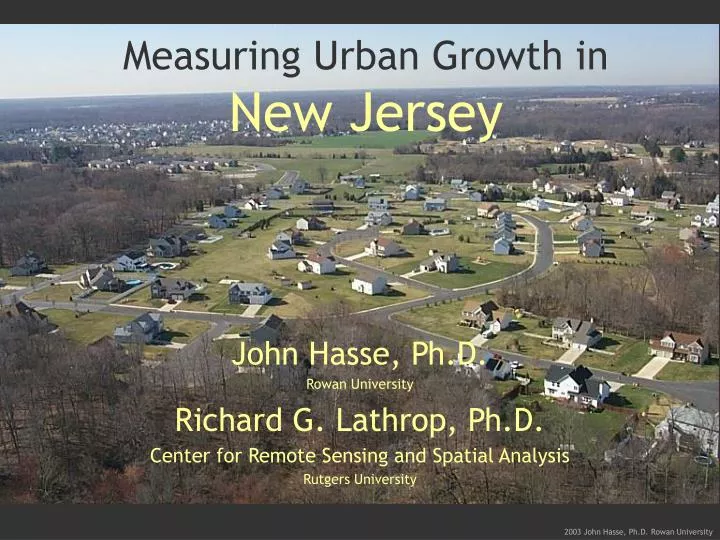
Measuring Urban Growth in New Jersey. John Hasse, Ph.D. Rowan University Richard G. Lathrop, Ph.D. Center for Remote Sensing and Spatial Analysis Rutgers University. Viewing Landscape Change with Satellite Remote Sensing. Recent Landscape Changes in New Jersey. Forest Loss (11 FF/day).

E N D
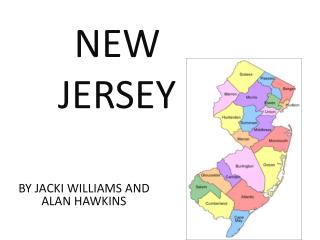
Measuring Urban Growth inNew Jersey John Hasse, Ph.D. Rowan University Richard G. Lathrop, Ph.D. Center for Remote Sensing and Spatial Analysis Rutgers University
Mullica Hill NJ 1986 to 1995 growth
Types of Urban Growth in Acres 45,448 ac Residential, Rural, Single Unit Other Urban or Built-Up Land 22,696 ac Residential, Single Unit, (Low Density) 21,434 ac Residential, Single Unit, (Medium Density) 20,194 ac Residential, High Density, (Multiple Dwelling) 11,099 ac Commercial / Services 9,137 ac Recreational Land 6,146 ac Industrial 5,352 ac 4,977 ac Transportation / Communication
Hunterdon County, ex urban sprawl: Rural , Single Unit Residential 1140 Single Unit Rural Res 58% units built, 88% land consumption All other residential 41% units built, 12% land consumption
% I M P E R V I O U S 45% 40% 35% 30% 25% 20% 15% 10% 5% 0% Hydrological Function of a Watershed DEGRADED IMPACTED
New Jersey Watershed Conditions and Impervious Surface % TOTAL IMPERVIOUS COVER IMPERVIOUS INCREASE
Urban Growth and the Pine Barrens Slide Under Construction
Findings & Conclusions • Rapid landscape change in NJ • NJ 1st to build out • Sprawl more impacting than Smart Growth • Impervious Surface a key indicator • Pinelands demonstrated effective growth control • Land Management Policies will be “designing” NJ’s Final Landscape
What is Urban Sprawl?What is Smart Growth? • “I know it when I see it”! • Many different definitions of sprawl. • Is all urban growth is sprawl? • Low density – most commonly shared language • Any development you don’t like • Etc…. • Need for a clear and consistent definition • Geographically / spatially based metrics • Sprawl has many different characteristics • Are there different kinds of sprawl? • Define appropriate scale of characterization?
Literature Defining Sprawl and Smart Growth Florida Growth Management Plan, 1993; Ewing, 1997; Downs, 1998; Burchell and Shad 1999; Sierra Club 1999; Vermont Forum on Sprawl 1999, Danielsen et al. (1999), Smart Growth Network (2002) EXAMPLE - Downs (1998) • unlimited outward extension of development • low-density residential and commercial settlements • leapfrog development • fragmentation of powers over land use among many smaller localities • heavy reliance on private automobiles as the primary transportation mode • no centralized planning or control of land uses • widespread commercial strip development • significant fiscal disparities among localities • segregation of land use types into different zones • reliance on a “trickle-down” or filtering process to provide housing to low-income households
Measures that Capture the Landscape-Impact of a Single Housing Unit: SMART GROWTH SPRAWL Sprawl patterns of development impart a far greater impact to a landscape per housing unit than Smart Growth patterns of development.
Sprawl Pattern Location, Configuration and Pattern of Development Impact Landscape Functionality SOCIO-ECOLOGICAL IMPACT On a landscape level, Sprawl creates a greater ecological and social impact per housing unit than Smart Growth.
Location, Configuration and Pattern of Development Impact Landscape Functionality Smart Growth Pattern SOCIO-ECOLOGICAL IMPACT On a landscape level, Smart Growth is less impacting to the environment and more socially cohesive
GIUS Sprawl/Smart Growth Measurements 2 LEAPFROG 1 DENSITY 2)Leapfrog Development - Dispersed development is another often-cited characteristic of sprawl. The leapfrog index provides a measure of how far a tract of new development is from the edge of a previously existing settlement. New development with large leapfrog distances is considered more sprawling than new development in close proximity or contiguous to previous settlement (i.e. infill or concentric growth). 1)Urban Density - Low-density urban growth is the one characteristic that is most often associated with sprawl. The urban density index provides a measure of how much land is consumed per capita for a tract of new development. Lower density (i.e. development that consumes greater amounts of land for each person housed) is indicative of more sprawling growth whereas higher density signifies less sprawling growth. 4 HIGHWAY STRIP 3 SEGREGATED LU 3) Segregated Land Use - A third characterization of sprawl is segregated land use in which development occurs in single-use zones where large areas of land consist of similar uses and classes of development. This homogenization of land use results in a less functionally efficient landscape in which every household activity requires automobile transportation whether it is commuting to work or school, gathering for social activities or shopping. New development with few or no alternate land uses within a reasonable pedestrian distance is considered more sprawling than new development that occurs within a mixture of neighboring land uses. 4) Highway Strip Development – Corridors of fast food and large, “big box” retailers exemplify the commercial expression of highway strip. Rural “ribbon” development where single residences line rural roads, often blocking scenic vistas and fragmenting rural lands typifies the residential form of highway-strip development. Development that occurs fronting on rural highway corridor is considered sprawling by this measure.
GIUS Sprawl/Smart Growth Measurements 6 ROAD INFRASTRUCTURE INEFFICIENCY 5 REGIONAL PLANNING INCONSISTENCY 5) Regional Planning Inconsistency- Many of the haphazard, disjointed and conflicting land use patterns of sprawl can be attributed to uncoordinated land use planning. The planning inconsistency index measures whether or not a tract of new development is consistent with a regional or state plan. Development that occurs in a manner that is disharmonious with regional planning goals is considered more sprawling than development that is consistent with the regional plan. 6) New Road Infrastructure Inefficiency - Sprawling residential and commercial developments create a less efficient road network of loops and lollipops, laying down greater lengths of new road lane miles, more cul-de-sac and fewer intersections per capita than more efficient grid networks often associated with compact patterns of smart growth. Development that creates greater lengths of lane-miles, more cul-de-sacs, and fewer intersections for each new person accommodated is more sprawling than development with a higher per capita road network efficiency pattern. 8 COMMUNITY NODE INACCESSIBILITY 7 ALT TRANSIT INACCESSIBILITY 7) Transit Inaccessibility- Sprawling development is often designed for the exclusive use of private automobiles as the sole means of transportation, neglecting the needs of willing pedestrians, bicyclists, and would-be users of public transportation. The alternate transit inaccessibility index measures the degree to which new development is accessible to transit or bus stops, bike paths and sidewalk/pedestrian paths. 8) Community Node Inaccessibility - Sprawling development spread growth haphazardly throughout a landscape. The result is a dysfunctional land use pattern that creates a lack of definable town identity; a necessarily inefficient transportation pattern; longer response times for emergencies; and diminished sense of community. The community node inaccessibility index measures the distance from a new development to important community nodes such as schools, emergency service stations, grocery stores, post offices, and recreational fields. New development that occurs at longer distances to important community nodes indicates a more sprawling pattern than development at closer proximity to community nodes.
GIUS Sprawl/Smart Growth Measurements 10 OPEN SPACE ENCROACHMENT 9 LAND RESOURCE IMPACTS 9) Loss of Important Land Resources – Urban growth often consumes important resources such as prime farmland, wetlands and critical habitat. Sprawling growth consumes undue amounts of these critical resources while housing relatively few people. This measure determines the loss of these resources for each new unit constructed. Development that consumes large proportions of important land resources per unit of new development is considered more sprawling than growth with a lower per unit consumption. 10) Encroachment on Sensitive Preserved Open Space –Some types of open land are sensitive to development that occurs too close. The open space encroachment index, as developed for this analysis, focuses on preserved open space that is intended to protect sensitive wildlife management areas or lands enrolled in the state farmland preservation program. Development that occurs closer to sensitive open space indicates a more sprawling pattern of urban growth that development that occurs at greater distances to sensitive open space. 12 GROWTH TRAJECTORY 11 IMPERVIOUS SURFACE PER CAPITA 11) Increased Per Unit Impervious Surface - Impervious surface is human-created land cover that reduces or eliminates the capacity of the underlying soil to percolate water thus impeding the natural infiltration of precipitation into the ground and increasing the flow of water directly into stream channels. Impervious surface is associated to water quality, flooding, groundwater recharge and erosion. Sprawling development is inefficient in its utilization of land thereby creating greater amounts of impervious surface for each new unit constructed. New urban growth that contributes large amounts of impervious surface per capita suggest a more sprawling development pattern than development that contributes smaller per capita amounts of impervious surface. 12) Urban Growth Trajectory - Urban sprawl has been associated with rapid, unlimited, explosive growth. The urban growth trajectory index provides an indication of the magnitude of change contributed by new development within the context of its location. The index is produced by measuring three components of the pace of development including: 1) the rate of urban growth; 2) the rate of growth relative to the locality; and 3) the degree to which new growth consumes remaining available land. New development that contributes a significant change to the urban fabric and/or consumes a significant amount of remaining available land is considered more sprawling than new urban growth that exhibits lower rates for this metric.