Download
1 / 15
150 likes | 156 Views
It has become common for companies to use long-term compensation arrangements to align executives with shareholder/stakeholders, but for these plans to be effective, you must understand how value is created before you can reward it.

E N D
TSG Fundamentals of Value Creation Jim Sillery Principal, The Sillery Group jimsillery@outlook.com 8/18/2019 1
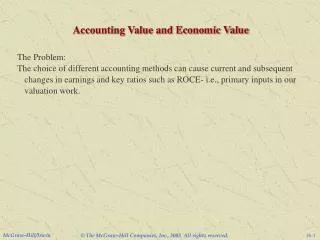
Creating Economic Value Empirical evidence shows that the stock market operates on economic principals, rather than accounting performance. Market valuation is driven on expectations of cash flows discounted by the cost of capital, both in terms of projected annual cash flows and a judgment about the likely continuing value of the business. Continuing Value Assets Liabilities Current Liabilities Market Value Current Assets "Working" Capital Long-Term Debt > = < Fixed Assets Shareholder Other Assets Equity Present Value of Company ABC Capitalization Time The Sillery Group 2 8/18/2019
Creating Economic Value To arrive at these cash flow patterns, a transformation of accounting earnings into a “cash-in, cash-out” context is required. This requires elimination of most of the non-cash transactions constructed in accounting earnings and then projection of the expected results into future period. As a result, cash flow trade-offs are fundamental to investment behavior and value creation. The concept of free cash flow is relatively simple: What periodic cash flows, positive or negative, are being created by the operating and investment activities of a company and what is their pattern over time, both achieved in the past and expected in the future? Essentially, operational and investment cash flows are netted out for each period of time to determine what balance, if any, is left. “Free” is defined as any cash not required for operational or strategic investment needs, representing funds available to service debt, pay dividends or modify the capital structure of the company. In broad terms, free cash flow is the net cash inflow or outflow of the first two sections of the cash flow statement. The Sillery Group 3 8/18/2019
Creating Economic Value It has been proven that the stock market, over time, reacts to the free cash flow patterns created by companies, as shown in the chart below. A positive trend, apart from period to period fluctuations cause by a mix of operational results and strategic investment, is the basis for value creation. Because of this direct relationship to the overall value of the business, free cash flow methodologies provide a more direct linkage to shareholder value creation. The Stock Market Reacts to Expected Free Cash Flows … Trend … in Effect a “Cash-in/Cash-out" View of Investment Payoff The Sillery Group 4 8/18/2019
Measuring Performance and Value Creation There is a broad spectrum of metrics used to measure the creation of stakeholder value, as shown in the chart below. These measures can be financial, economic or a combination of the two. Some are used to drive the creation of future value while others are used to measure the value that has been created over a period of time. In choosing the appropriate measure, companies must balance the complexity of the model with their need for comprehensiveness and technical accuracy. Return, Growth, Cost of Capital and Free Cash Flow • CEROI • TBR Increasing Comprehensiveness, Value Drivers Return, Growth and Cost of Capital • CVA • EVA • RORAC Technical Accuracy Return • ROIC • RONA/ROCE • ROE Growth • Free Cash Flow • EPS Growth • EBIT Growth • Revenue Growth Value Based Metrics Increasing Complexity The Sillery Group 5 8/18/2019
Measuring Performance and Value Creation Financial Measures Historically, companies have used the fairly simple relationships of accounting profits to sales and profit growth. This focused on drivers, rather than metrics of value creation. However, empirical evidence has shown there is a relatively low correlation between accounting earnings and value creation. This research has shown that accounting earnings cannot serve as a reliable and consistent valuation measure for three primary reasons: • The nature of accounting principles themselves; accounting earnings increasingly represent an a series of judgments open to various degrees of interpretation. • The impact of an earnings pre-occupation on corporate decision making. • The evidence that corporate valuation is essentially an economic principle. Commonly-used measures, such as return on assets (“ROA”), return on equity (“ROE”) and return on capital employed (“ROCE”) are all based on highly complex accounting principles that require a large number of subjective decisions. As a result, they are not effective in accurately measuring economic value creation. Financial measure are often used foe aligning executives with key outcomes linked to strategic business plans and best suited to for plans with a short-term period. The Sillery Group 6 8/18/2019
Measuring Performance and Value Creation Economic Value Added (“EVA”) EVA, which was introduced by Stern Stewart, is an advancement on conventional thinking since it focuses on economic profit achieved in excess of the cost of capital. Today, it is still the most widely-used value creation model. EVA serves as a yardstick to measure if the business is earning above its cost of capital of resources it employs Deriving the appropriate figures from the accounting data available in a company involves a variety of adjustments. In the case of the adjustments used to calculate economic profit, the focus tends to be on separating non-operating from operating aspects in both the operating results and the related investment base and less on cash flow principles. This adds an additional level of complexity since adjustments often need to be added for different types of businesses or stages of development. Major examples of adjustment areas are goodwill amortization, capitalization of operating leases and major research and promotional expenses, inventory value adjustments where the LIFO method is used and modifying the impact of deferred income taxes. The desired result of this analysis is to establish a reasonably representative NOPAT, which can be held against a representative operating investment base. The weighted cost of capital percentage is then applied against this modified investment base and the result is subtracted from NOPAT. The Sillery Group 7 8/18/2019
Measuring Performance and Value Creation Economic Value Added (“EVA”) The key benefit of using economic profit, as measured by EVA, lies in its simplicity as a performance measure and in its intuitive indication that there is a cost to employing resources – a cost that has to be met and preferably exceeded. It is here where EVA’s contribution the evolution of management performance thinking has been strongest ,and as a result the concept has been used in many incentive compensation arrangements. The Sillery Group 8 8/18/2019
Measuring Performance and Value Creation Cash Value Added (“CVA”) A well known economic model is Cash Value Added (“CVA”), which was developed by Ottosson and Weissenreider. CVA is a relatively simple and effective model that is based on discounted cash flow. CVA is similar to Economic Value Added (“EVA”) but takes into consideration only cash generation as a opposed to economic wealth generation. This measure helps give investors an idea of the ability of a company to generate cash from one period to another. Generally speaking, the higher the CVA the better it is for the company and for investors. CVA simulates the value of the company as it stands today and the present value of its strategic investments. It represents value creation from the shareholders point of view. The principle is simple: the cash-flow demand is calculated from the parameters of investment amount, span and the cost of capital. The cash-flow demand reflects the cash flow that over time must be generated to provide a present value that equals zero for the expected span of the investment. In this application, CVA classifies investments differently than other models. Investments are classified as either strategic investments, which are made to create value, and non- strategic investments, which are made to maintain value. CVA is calculated as the amount of cash generated by a company through its operations in excess of its cost of capital. The Sillery Group 9 8/18/2019
Measuring Performance and Value Creation More Complex Models A more robust – and complex – model is Cash Flow Return on Investment (CFROI). While much more complex than EVA or CVA, CFROI provides a direct linkage to valuation. CFROI, an economic model developed by Holt Value Associates, is the most direct principle relating performance to the value of a business. CFROI expresses the principle that the value of a business represents the present value of its expected free cash flow over a relevant period of time, and the residual value that is assumed to exist at the end of the analysis period. Boston Consulting has extended this concept through its TBR model, which is based on both free cash flow and estimates of the beginning and ending values of the entity, much like the analysis of an investment project. TBR is not a valuation measure as such. TBR is in effect the internal rate of return of free cash flow to which have been added a beginning and ending value of the business. TBR is essentially the sum of the CVA that has been created and the change in capitalized value. The Sillery Group 10 8/18/2019
Measuring Performance and Value Creation Summary Models that use cash flow as a basis for value creation have been effective, particularly in companies that do not have publicly traded stock, who feel that their stock price may not correlate closely with company performance or who want to establish a measure that serves as a driver for value creation. These models can determine whether a business is creating or destroying value while the latter measures both the immediate impact of the free cash flow and the change in capitalization value. The decision on an economic model is often a balance of the desire for simplicity with the need for robustness in the model. The Sillery Group 11 8/18/2019
Glossary of Terms Cash Value Added (“CVA”): CVA measures the return generated by the business minus the charge for capital used in generating the returns. CVA can be described as the spread between CFROI and the cost of capital multiplied by the asset base. A business with a positive CVA value is generating returns above the cost of capital. Earnings Per Share (“EPS”) Growth: The portion of a company's profit allocated to each outstanding share of common stock. EPS is calculated as net income minus dividends on preferred shares divided by average outstanding shares. EPS growth represents the change in EPS over a fixed period of time. Earnings Before Interest and Tax (“EBIT”) Growth: EBIT is an indicator of a company's financial performance calculated as revenue minus expenses excluding tax and interest. Also referred to as operating earnings. This is all profits, operating and non-operating, before deducting interest and income taxes. EBIT growth represents the change in EPS over a fixed period of time. Economic Value Added (“EVA”): A measure of a company's financial performance based on the residual wealth calculated by deducting cost of capital from its operating profit (adjusted for taxes on a cash basis). The formula for calculating EVA is as Net Operating Profit After Taxes (NOPAT) minus the product of capital times the cost of capital. The Sillery Group 12 8/18/2019
Glossary of Terms Free Cash Flow (“FCF”): A measure of how much cash a company has after paying its bills for ongoing activities and growth. Free cash flow is calculated by adding depreciation to net income and then subtracting capital expenditures. Free cash flow represents the cash available for a company to spend after financing its capital projects. Revenue Growth: The dollar amount of sales during a specific period, including discounts and returned merchandise. It is the "top line" figure from which costs are subtracted to determine net income. When evaluating company equity, revenue growth can serve as an indication of a company's health. Return on Capital Employed (“ROCE”): A ratio that indicates the efficiency and profitability of a company's capital investments. ROCE is calculated as EBIT divided by total assets less current liabilities. ROCE should always be higher than the rate the company borrows at, otherwise any increase in borrowings will reduce shareholders' earnings. Return on Equity (“ROE”): A measure of a corporation's profitability, calculated as net income divided by shareholder’s equity. The ROE valuation is useful in comparing the profitability of a company to other firms in the same industry. The Sillery Group 13 8/18/2019
Glossary of Terms Return on Invested Capital (“ROIC”): A calculation used to determine the quality of a company. The general definition for ROIC is net income minus dividends divided by total capital. Total capital includes long term debt and common and preferred shares. Since some companies receive income from other sources, or have other conflicting items in their net income, NOPAT may be used instead. ROIC is always calculated as a percent. Return on Net Assets (“RONA”): A measure of financial performance calculated as net income divided by the sum of fixed assets plus working capital. The higher the return, the better the profit performance for the company. Return on Risk Adjusted Capital (“RORAC”): RORAC Is a target ROE measure in which the denominator is adjusted depending on the risk associated with the instrument or project. Total Business Return (“TBR”): TBR models the shareholder return investors receive from equity ownership. TBR is the most comprehensive and robust measure of value creation because it incorporates both the immediate impact of the free cash flow (the dividend) and the capitalized value of change in returns and growth (the equity appreciation). The Sillery Group 14 8/18/2019
TSG 8/18/2019 15