Download
1 / 19
190 likes | 332 Views
MULTIMODAL MRI AND OVERALL DIAGNOSTIC ACCURACY IN NON-ENHANCING BRAIN GLIOMAS. S. Gaudino , V. Lorusso, M. Caulo * , A. Tartaro * , T. Tartaglione, G.M. Di Lella, C. Colosimo Dept. of Bio-imaging and Radiological Sciences, Policlinico “A. Gemelli” Catholic University of Rome – ITALY

E N D
MULTIMODAL MRI AND OVERALL DIAGNOSTIC ACCURACY IN NON-ENHANCING BRAIN GLIOMAS S. Gaudino, V. Lorusso, M. Caulo *, A. Tartaro *, T. Tartaglione, G.M. Di Lella, C. Colosimo Dept. of Bio-imaging and Radiological Sciences, Policlinico “A. Gemelli” Catholic University of Rome – ITALY *ITAB - Istituto di Tecnologie Avanzate Biomediche, “G. d’Annunzio” University, Chieti-Pescara – ITALY simona.gaudino@rm.unicatt.it
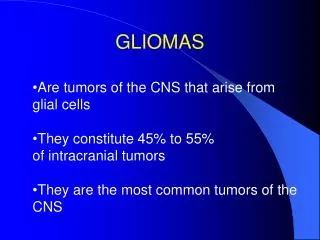
Introduction • Gliomas account for more than 70% of primary brain tumors and they present considerably heterogeneous neuropathological, genetic and clinical feature • WHO grade II and III gliomas represent a heterogeneous group of tumors, also regarding their potential of malignant transformation • With conventional MRI the assessment of gliomas grade may be limited, potentially affecting therapeutic decision making • Contrast enhancement reflects only disruption of the blood-brain-barrier (BBB) and not tumor angiogenesis • In fact 14-45% of non-enhancing supratentorial gliomas are malignant and 20% of low grade gliomas enhance after gadolinium (e.g. pilocytic astrocytomas)
Introduction • These limits could be overcome by integrating morphological information with “functional” MR techniques • Diffusion WI: information on lesion cellular content • Perfusion WI: degree of perfusion generally reflects the degree of microvascularity or neovascularity (angiogenesis) of the tumoral lesion • MR Spectroscopy: information related to the metabolic aspects of the tumor J MagnReson Imaging (1999) 9:53–60 Neuroradiology (2008) 50:759–767 Neuroradiology (2002) 44:371–381
Purpose • The aim of this study was to assess the contribution of diffusion weighted imaging (DWI), perfusion weighted imaging (PWI) and magnetic resonance spectroscopy (MRS) to the diagnostic work-up of Non-Enhancing Gliomas (NEGs)
Materials and methods • We reviewed MRI studies of 31 Patients with histopathologically confirmed brain gliomas with no CE on MRI, collected from two Italian University Hospitals • Only 22 Pts who have not undergone chemotherapy or radiotherapy before MRI examination were included in the study (15 males, 7 females; age range 19 to 81 year; mean ages 46.6 years) • 13 Patients were studied with a 1.5 T and 9 with a 3 T system, using pre-contrast conventional MRI and multi-planar post-Gd T1-w images • All pts underwent DWI (b 0-1000) and PWI (dynamic first-passage gadolinium-enhanced gradient-echo sequence) • 12 pts underwent MRS (MV, TE 144)
Materials and methods • Two neuroradiologists evaluated for each lesions: signal intensity, margins, the presence of cysts, hemorrhage, edema • ROI, varying from 20 mm2 to 60 mm2, were positioned in the area of maximum and minimum signal intensity (SI) on T2-w images. In these area ADC values, rCBV and rMTT values were calculated. Minimum ADC value and highest rCBV values were also measured. Cho/Cr (area and height), Cho/NAA (area and height) , Lip/Cr (height), Lac/Cr (height) were measured in the focus of highest rCBV • rCBV, rMTT and ADC normalized between tumor and healthy tissue • Pts were divided in two group: LGG and HGG • All data obtained were summarized as the mean ± standarddeviation • Statistical analysis: Student t-test, chi-squared test, ROC curves (SPSS version 19, MedCalc v10.2)
Materials and methodsSamplingareas • The highest (1) and lowest (2) area of signal intensity on T2 FSE axial image • The ADC value in these two areas • The area of lowest ADC value (3) • The rCBV and rMTT values of areas 1, 2 and 3 and the values of highest CBV (and its relative MTT) within the lesion (4) 1 2 Signal intensity values 2 1 3 ADC values 2 4 3 1 CBV, MTT values • On the area 4 we calcolated Cho/Cr (area and height), Cho/NAA (area and height) , Lip/Cr (height), Lac/Cr (height)
Results-1 Of 22 gliomas : • 13 Astro: 9 WHO grade II, 4 WHO grade III • 9 ODG: 8 WHO grade II, one WHO grade III • In total : 17 grade II and 5 grade III Morphological assessment: • SI was homogeneous in 10 pts (8grade II, two grade III), • Margins were ill-defined in most of the gliomas (16/22), edema was evident in 6 lesions • Only one lesion showed cystic component and one necrosis (both grade II)
Results-2 • The average rCBV was: • in the areas of low T2 SI =1,42 • In the areas of high T2 SI = 0.98 • In the areas of low ADC =1,37 • ADC values in areas of low T2 SI =1,18 • grade II: rCBV • low T2 SI =1,22 • high T2 SI = 0,90 • low ADC =1,17 • ADC= 1.24 • grade III: rCBV • low T2 SI =2,15 • high T2 SI = 1,25 • low ADC =2,08 • ADC= 1.03
Results-3 Between grade II and grade III gliomas • The difference in age and gender is not statistically significant • There are no significant differences for signal intensity, cysts, necrosis, hemorrhages or edema • There was a significant difference in rCBV between grade II and III (comparing all gliomas grade II vs III, and between ODG II and Astro III) in the areas of low T2 and low ADC • When SI was inhomogeneous in 12/12 pts the lowest ADC value resulted in the area of low T2 SI • Regarding MRS: the only variable that gave a significant p was Cho/NAA (area) but only one subject was in the high grade group
Results-3 An high probability for a gliomas to be a high-grade lesion was associated with a rCBV tumor/normal tissue ratio of >1.89 both in low T2 SI and low ADC
Case-1M 33 ys L-deep lesion. Inhomogeneous SI, well-defined margins, cystic component DWI,PWI, MRS deponed for LGG Astro II
Case-2M 44 ys L-frontal lesion. Inhomogeneous SI, necrosis, ill-defined margins Areas of low ADC High rCBV No MRS ODG II
Case-3M 70 ys R-parietal lesion. Inhomogeneous SI, ill-defined margins, necrosis PWI MRS deposed for HGG ODG II
Case-4M 43 ys Astro grade II with foci ofgrade III
Conclusions • The lack of contrast enhancement on MR studies of brain gliomas does not always couple with a low grade tumor, and up to 25% of HGG are faintly or completely non-enhancing • Accurate tumor grading is essential for a rational therapeutic approach • In conventional MR imaging, reported values for accurate grading of gliomas varies from 55% to 83.3%* • DWI, PWI, and MRS provide useful data for tumor evaluation and grading Neuroradiology (1994) 36:308–310
Conclusions • Our case series confirmed the correspondence between low T2 SI, low ADC values and increased rCBV within inhomogeneous gliomas • In grade III ADC values were slightly lower respect to grade II, without a threshold value to separate grade II from grade III lesions • The relevance of increased Cho/NAA (area) in HGG undoubtedly needs further investigation • Our results suggest that rCBV measurement may be more accurate than DWI and MRS in the identification of high-grade gliomas • Doubtless, the combination of PWI, DWI and MRS with conventional MRI increases the diagnostic accuracy in differentiating high from low-grade NEGs
Thank You for Your attention Our acknowledgments to P Mattei & C Schiarelli MD