Download
1 / 10
100 likes | 104 Views
Why doesn’t real GDP always give an accurate gauge the health of the U.S. economy? Why do many people look to the unemployment rate as a more telling measure of the health of the U.S. economy?. Unemployment.

E N D
Why doesn’t real GDP always give an accurate gauge the health of the U.S. economy? Why do many people look to the unemployment rate as a more telling measure of the health of the U.S. economy?
Unemployment Essential Questions: What are the causes of unemployment? How is the unemployment rate impacted by fluctuations in the business cycle?
Cyclical Unemployment Definition: Example: Structural Unemployment Definition: Example: Unemployed – Unemployment Rate – Full Employment – Technological Unemployment Definition: Example: Types of Unemployment Frictional Unemployment Definition: Example: Seasonal Unemployment Definition: Example:
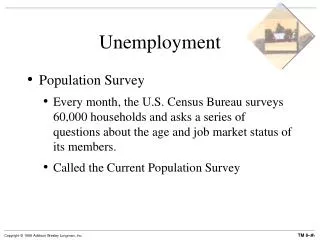
Use the unemployment statistics to answer the following questions: • The “Great Recession” began in December 2007. Describe the trend in the unemployment rate since December 2007. • Since 1947, which years had an unemployment rate above 7%? Circle them. • Since 1947, which years had an unemployment rate below 4%? Underline them. • In the last thirty years, when was our economy at “full employment”? • Describe the trend in the labor participation rate since 1945. To do this, look at the “Percent of Population” in the “Civilian Labor Force” • Describe the trend in the number of people employed in agriculture. Why do you think this is the case? http://www.bls.gov/CPS/ Go to “CPS Tables” → “Employment status of the population, 1940s to date”
According to the article, what is the weakness of the official unemployment rate? • Who is considered “marginally attached to the labor force”? • Who is considered to be a “discouraged worker”?
U-1: Persons unemployed 15 weeks or longer • U-2: Percentage of people who lost jobs or completed temporary work • U-3: Total unemployed (official unemployment rate) • U-4: U-3 + “discouraged workers” • U-5: U-4 + “persons marginally attached to the labor force”. • U-6: U-5 + part-time workers who want to work full time but can’t find full-time jobs. http://www.bls.gov/news.release/empsit.t15.htm