Download
1 / 49
490 likes | 623 Views
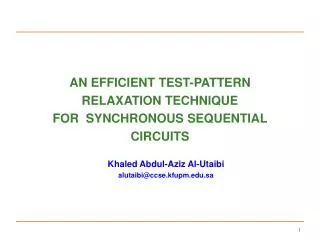
AN EFFICIENT TEST-PATTERN RELAXATION TECHNIQUE FOR SYNCHRONOUS SEQUENTIAL CIRCUITS Khaled Abdul-Aziz Al-Utaibi alutaibi@ccse.kfupm.edu.sa. Outline. Introduction Motivation Problem Definition Existing Solutions Proposed Technique Experimental Results Conclusion & Future Work.

E N D
AN EFFICIENT TEST-PATTERN RELAXATION TECHNIQUE FOR SYNCHRONOUS SEQUENTIAL CIRCUITS Khaled Abdul-Aziz Al-Utaibi alutaibi@ccse.kfupm.edu.sa
Outline • Introduction • Motivation • Problem Definition • Existing Solutions • Proposed Technique • Experimental Results • Conclusion & Future Work
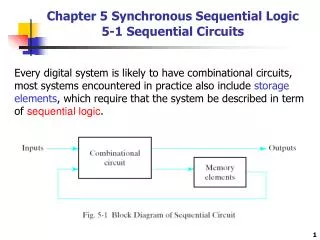
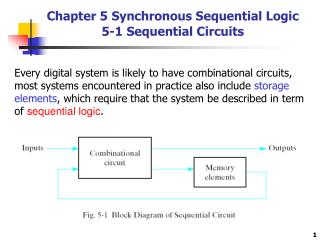
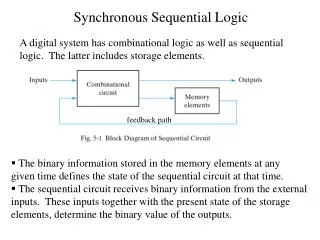
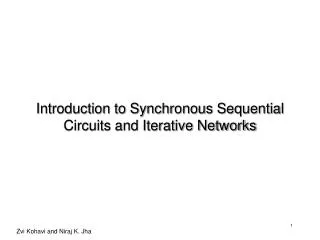
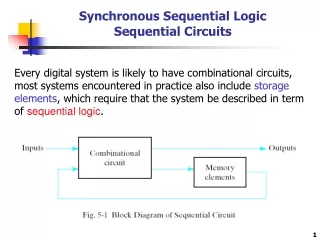
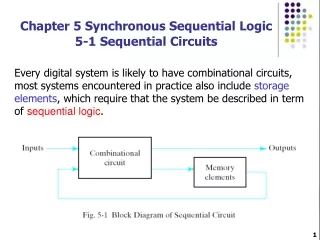
Introduction • System-On-Chip (SOC) • Rapid advancement in VLSI technology has lead to a new paradigm in designing integrated circuits where a SOC is constructed based on pre-designed and pre-verified cores such as CPUs, digital signal processors, and RAMs. • Testing SOC • To deal with a large amount of test data that must be loaded from the tester memory, transferred to the SOC, and applied to the individual cores.
Introduction • Test Data Compression • The objective of test data compression is to compress (encode) a given test set TD to a much smaller test set TE that is stored in the tester memory. • During test application, TE is loaded from the tester memory and decompressed (decoded) to obtain the original test set TD before applying it to the required core. • Test Data Compaction • In test compaction, the number of test vectors is reduced into a smaller number that achieves the same fault coverage.
Motivation • Compression Techniques • Schemes that require test data to be in the form of test cubes (Ex. LFSR reseeding). • Schemes that require fully specified test vectors such as variable-to-fixed-length codes, variable-to-variable-lengthcodes and Huffman coding. • Schemes that have no specific requirements about the type of the test data (Ex. Run-length coding). They compress test data regardless of their type.
Motivation • Compaction Techniques • Compaction techniques can benefit from partially specified test sets. • For example, when merging two test sequences by overlapping self-initializing test sequences, a don't care value, 'x', can be merged with any one of the values: '0', '1', and 'x'. • Therefore, increasing the number of x's in a test set will reduce the number of conflicts that may occur when merging two test sequences.
Problem Definition • Given a synchronous sequential circuit and a fully specified test set, generate a partially specified test set that maintains the same fault coverage as the fully specified one while maximizing the number of unspecified bits.
Existing Solutions • Dynamic ATPG Compaction • Every test vector is processed immediately after its generation in order to specify the unspecified PIs. • Generally, unspecified assignments are filled with random values. • This feature can be disabled to obtain a compact and relaxed test set. • However, assigning random values to the unspecified PI’s may result in detecting additional faults that have not been detected with the partially specified assignments. • Furthermore, this technique does not solve the problem of relaxing an already existing test set.
Existing Solutions • Single-Bit Relaxation (Brute-Force) • Test for every bit of the test set whether changing it to an X reduces the fault coverage or not. • This technique is O(nm) fault simulation runs, where n is the width of one test vector, m is the number of test vectors, and • Obviously, this technique is impractical for large circuits.
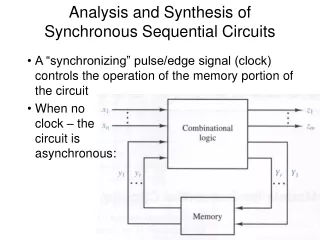
Proposed Technique • General Behavior • At every time frame t, all logic values which are necessary detect a newly detected fault are marked as required. • Next, these logic values are justified backwards towards primary inputs and/or memory-elements. • At the end, any primary input that is not marked as required during the justification process is relaxed. • On the other hand, required values on the memory-elements are justified when time frame, t-1, is processed. x
Proposed Technique • Single-Value Justification • Justification process is based on fault-free values only • This may result in masking some of the detected faults. • Therefore, rules based on fault-reachability analysis are used to avoid fault masking. • Two-Values Justification • Justify both fault-free and faulty values of the circuit that are necessary to excite/propagate every newly detected fault. • Reachability analysis is not required.
Single-Value Justification x 0 x 0 1 1 x 1 0 G7/0
Selection Criteria • When justifying a controlling value through the inputs of a given gate, there could be more than one choice. • In this case, the priority is given to the input that is already selected to justify other gates. • Otherwise, cost functions are used to guide the selection. • Cost functions give a relative measure on the number of primary inputs required to justify a given value. • Hence, they can guide the relaxation procedure to justify the required values with the smallest number of assignments on the primary inputs.
Selection Criteria (Regular Cost Func.) • Regular Cost Functions • For every gate, g, we compute two cost functions: Creg0(g) and Creg1(g). • For example, if g is an AND gate with i inputs, then the cost functions are computed as: • These cost functions are computed for other gates in a similar manner.
Selection Criteria (Regular Cost Fun.) Creg1(G1) = 3 Creg1(G2) = 2 Creg0(A) = 1 Creg0(B) = 1 Creg0(C) = 1
Selection Criteria (Fanout-Based Cost) • Fanout-based Cost Functions • These cost functions can be computed for an AND gate as follows. • Let g be an AND gate with i inputs. • Let F(g) denotes the number of fanout branches of g. • Then, the fanout-based cost functions are computed as:
Selection Criteria (Cost Functions) Cfan0(A) = 1 Cfan0(B) = 0.5 Cfan0(C) = 1
Selection Criteria (Cost Functions) • Regular cost functions are accurate for fanout-free circuits. • However, they do not take advantage of the fact that a stem can justify several required values. • In general, the fanout-based cost functions provide better selection criterion than the regular cost functions. • However, there are some cases where the regular cost • functions can perform better. • To take advantage of both cost functions, a weighted sum cost function of the two cost functions can be used.
Selection Criteria (Sequential Circuits) • In synchronous sequential circuits, the controllability values of the circuit in one time frame depend on the controllability values computed in the current frame as well as the values computed in the previous frames. • Therefore, the controllability values should be computed in an iterative manner starting from the first time frame. • However, the iterative computation of the controllability over several time frames may cause the regular cost function to grow much faster than the fanout-based cost function. • In this case, the effect of the second cost function in the weighted sum becomes negligible.
Selection Criteria (Reconvergant Fanouts) C1 = v +1 C1 = 1 C1 = 2v+1 C1 = v C1 = 3v+1
Selection Criteria (Reconvergant Fanouts) C= v/m C(B)= v C= v
Selection Criteria (Reconvergant Fanouts) C1 = v/3 +1 C1 = 1 C1 = 2v/3 +1 C1 = v C1 = v+1
Selection Criteria (Actual Values) • The cost functions described so far assume equal probability of a line having a value of 0 or 1. • Computing the controllability with this assumption is less accurate than computing the controllability based on the actual logical values. C1=3 C1=1 C1=3 C1=2
Experimental Results • Experiments were performed on a number of ISCAS89 benchmarks. • Experiments were run on a SUN Ultra60 (UltraSparc II 450MHz) with a RAM of 512MB. • Test sets generated by HITEC. • The fault simulator HOPE was used for fault simulation purposes.
Experimental Results • Comparison between proposed technique (Two-Values Justification) & Single-Bit Relaxation (Brute-Force) in terms of percentage of X’s and CPU time. • Experiments on Cost Functions. • Comparison between single-value justification & two-values justification in terms of percentage of X’s. • Effect of computing the cost functions based on the actual logical values as compared to equal-probability logical values. • Effect of using the adjusted regular cost function on the consistency of the results.
Experimental Results • Benchmark Circuits
Experimental Results • The difference in the percentage of X’s ranges between 1% and 7%. • Average difference is about 3%.
Experimental Results • Comparison between Single-Bit Relaxation (Brute-Force) & Proposed Technique in terms of CPU time
Experimental Results • Cost Functions Effect on the Extracted Percentage of X’s
Experimental Results • Comparison between Two-Values & Single-Value Justification in terms of Percentage of X’s
Experimental Results • Effect of Computing Cost Functions Based on Actual or Equal-Prob. Logical Values
Experimental Results • Percentage of X’s Obtained Using Unadjusted Regular Cost Function
Experimental Results • Percentage of X’s Obtained Using Adjusted Regular Cost Function
Conclusion • Proposed a new technique for relaxing test-patterns in synchronous sequential circuits. • Proposed technique is faster than single-bit relaxation (brute-force) method by several order of magnitude. • Percentage of X’s obtained by the proposed technique is close to the percentage of X’s obtained by single-bit relaxation (brute-force) for most of the circuits. • The difference in percentage of X’s ranges between 1% and 7%. • Average difference is about 3%.
Conclusion • It should be observed that for fault detection, single-bit relaxation (brute-force) implicitly chooses a primary output that maximizes the number of X’s. • However, the proposed technique does not do any optimization in selecting POs for fault detection. • When justifying a fault that is detected through more than one output, the proposed technique will select one of these primary output to justify the detected fault without taking into consideration that some primary outputs can lead to more relaxation than others.
Introduction • Use built-in self-test (BIST) • Ability of self-testing at normal clocking rates. • Ability for testing systems on-line. • Reducing or eliminating the need for the expensive ATE's. • Complexity of designing test tools. • Degradation of the system performance due to added hardware. • BIST tools can't achieve high fault coverage because some faults are hard-to-detect using random test vectors. • Use compression & compaction techniques to reduce the amount of test data.
Problem Definition • Test-Pattern Relaxation for Synchronous Sequential Circuits • Given a synchronous sequential circuit and a fully specified test set, generate a partially specified test set that maintains the same fault coverage as the fully specified one while maximizing the number of unspecified bits. 00 00 11 x0 x0 11
Selection Criteria (Fanout-base Cost) (1, 0.5) (1, 1) (1, 0.5) (1, 0.5) (1, 0.5) (2, 1) (1, 1) (1, 0.5) (1, 1) (1, 0.5) (1, 0.5) (1, 0.5) (1, 1) (1, 1)
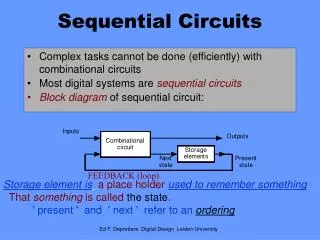
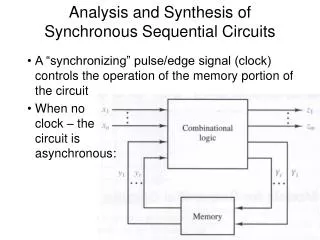
Proposed Technique • Definitions & Terminology • A synchronous sequential circuit can be represented as a linear iterative array of combinational cells. • Each cell represents one time frame in which • the current states of the flip-flops become pseudo-inputs and the next states become pseudo-outputs. • A fault in this model is represented as multiple identical faults (one in every cell).
Proposed Technique • Definitions & Terminology • The notation l/v is used to indicate that a line lis stuck at value v. • The notation l=v/v’ is used to indicate that the fault-free value of l is v, and the faulty value of lis v’. • When we say that a line l is required, we mean that the value on l is required.
Selection Criteria (Reconvergant Fanouts) C1 = v + 1 C1 = 1 C1 = 2v + 2 C1 = v C1 = 1 C1 = v + 1