Download
1 / 7
80 likes | 383 Views
Financial Analysis. Faulkender Company Comparative Balance Sheet December 31, 2009 and 2008 2009 2008 Cash $ 22,000 $ 20,000 Accounts receivable 41 ,500 39,000 Inventory 72 ,000 64,000 Plant and equipment 288,000 265 ,000 Accumulated depreciation ( 80 ,000) ( 72 ,000)

E N D
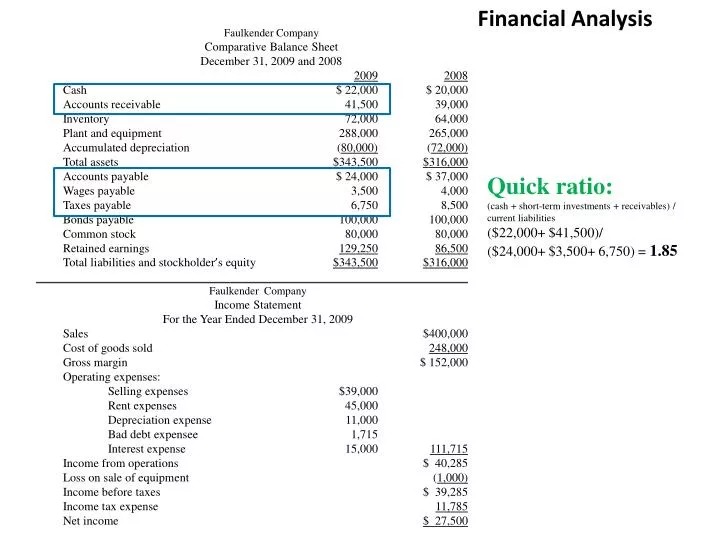
Financial Analysis Faulkender Company Comparative Balance Sheet December 31, 2009 and 2008 20092008 Cash $ 22,000 $ 20,000 Accounts receivable 41,500 39,000 Inventory 72,000 64,000 Plant and equipment 288,000 265,000 Accumulated depreciation (80,000) (72,000) Total assets $343,500$316,000 Accounts payable $ 24,000 $ 37,000 Wages payable 3,500 4,000 Taxes payable 6,750 8,500 Bonds payable 100,000 100,000 Common stock 80,000 80,000 Retained earnings 129,25086,500 Total liabilities and stockholder’s equity $343,500$316,000 ________________________________________________________________________ Faulkender Company Income Statement For the Year Ended December 31, 2009 Sales $400,000 Cost of goods sold 248,000 Gross margin $ 152,000 Operating expenses: Selling expenses $39,000 Rent expenses 45,000 Depreciation expense 11,000 Bad debt expensee 1,715 Interest expense 15,000 111,715 Income from operations $ 40,285 Loss on sale of equipment (1,000) Income before taxes $ 39,285 Income tax expense 11,785 Net income $ 27,500 Quick ratio: (cash + short-term investments + receivables) / current liabilities ($22,000+ $41,500)/ ($24,000+ $3,500+ 6,750) = 1.85
Financial Analysis Faulkender Company Comparative Balance Sheet December 31, 2009 and 2008 20092008 Cash $ 22,000 $ 20,000 Accounts receivable 41,500 39,000 Inventory 72,000 64,000 Plant and equipment 288,000 265,000 Accumulated depreciation (80,000) (72,000) Total assets $343,500$316,000 Accounts payable $ 24,000 $ 37,000 Wages payable 3,500 4,000 Taxes payable 6,750 8,500 Bonds payable 100,000 100,000 Common stock 80,000 80,000 Retained earnings 129,25086,500 Total liabilities and stockholder’s equity $343,500$316,000 ________________________________________________________________________ Faulkender Company Income Statement For the Year Ended December 31, 2009 Sales $400,000 Cost of goods sold 248,000 Gross margin $ 152,000 Operating expenses: Selling expenses $39,000 Rent expenses 45,000 Depreciation expense 11,000 Bad debt expensee 1,715 Interest expense 15,000 111,715 Income from operations $ 40,285 Loss on sale of equipment (1,000) Income before taxes $ 39,285 Income tax expense 11,785 Net income $ 27,500 Current ratio: Current assets/Current liabilities ($22,000+ $41,500+ $72,000)/ ($24,000+ $3,500+ 6,750) = 3.96
Financial Analysis Faulkender Company Comparative Balance Sheet December 31, 2009 and 2008 20092008 Cash $ 22,000 $ 20,000 Accounts receivable 41,500 39,000 Inventory 72,000 64,000 Plant and equipment 288,000 265,000 Accumulated depreciation (80,000) (72,000) Total assets $343,500$316,000 Accounts payable $ 24,000 $ 37,000 Wages payable 3,500 4,000 Taxes payable 6,750 8,500 Bonds payable 100,000 100,000 Common stock 80,000 80,000 Retained earnings 129,25086,500 Total liabilities and stockholder’s equity $343,500$316,000 ________________________________________________________________________ Faulkender Company Income Statement For the Year Ended December 31, 2009 Sales $400,000 Cost of goods sold 248,000 Gross margin $ 152,000 Operating expenses: Selling expenses $39,000 Rent expenses 45,000 Depreciation expense 11,000 Bad debt expensee 1,715 Interest expense 15,000 111,715 Income from operations $ 40,285 Loss on sale of equipment (1,000) Income before taxes $ 39,285 Income tax expense 11,785 Net income $ 27,500 Gross margin ratio: gross margin / sales $152,000/$400,000= 38%
Financial Analysis Faulkender Company Comparative Balance Sheet December 31, 2009 and 2008 20092008 Cash $ 22,000 $ 20,000 Accounts receivable 41,500 39,000 Inventory 72,000 64,000 Plant and equipment 288,000 265,000 Accumulated depreciation (80,000) (72,000) Total assets $343,500$316,000 Accounts payable $ 24,000 $ 37,000 Wages payable 3,500 4,000 Taxes payable 6,750 8,500 Bonds payable 100,000 100,000 Common stock 80,000 80,000 Retained earnings 129,25086,500 Total liabilities and stockholder’s equity $343,500$316,000 ________________________________________________________________________ Faulkender Company Income Statement For the Year Ended December 31, 2009 Sales $400,000 Cost of goods sold 248,000 Gross margin $ 152,000 Operating expenses: Selling expenses $39,000 Rent expenses 45,000 Depreciation expense 11,000 Bad debt expensee 1,715 Interest expense 15,000 111,715 Income from operations $ 40,285 Loss on sale of equipment (1,000) Income before taxes $ 39,285 Income tax expense 11,785 Net income $ 27,500 Return on sales ratio: Net income/Sales $27,500/$400,000= 6.88%
Financial Analysis Faulkender Company Comparative Balance Sheet December 31, 2009 and 2008 20092008 Cash $ 22,000 $ 20,000 Accounts receivable 41,500 39,000 Inventory 72,000 64,000 Plant and equipment 288,000 265,000 Accumulated depreciation (80,000) (72,000) Total assets $343,500$316,000 Accounts payable $ 24,000 $ 37,000 Wages payable 3,500 4,000 Taxes payable 6,750 8,500 Bonds payable 100,000 100,000 Common stock 80,000 80,000 Retained earnings 129,25086,500 Total liabilities and stockholder’s equity $343,500$316,000 ________________________________________________________________________ Faulkender Company Income Statement For the Year Ended December 31, 2009 Sales $400,000 Cost of goods sold 248,000 Gross margin $ 152,000 Operating expenses: Selling expenses $39,000 Rent expenses 45,000 Depreciation expense 11,000 Bad debt expensee 1,715 Interest expense 15,000 111,715 Income from operations $ 40,285 Loss on sale of equipment (1,000) Income before taxes $ 39,285 Income tax expense 11,785 Net income $ 27,500 A/R turnover: sales / average accounts receivable 400,000/([$39,000+ 41,500]/2) = 9.9379 times Days in the collection period: 365 / 9.9379 = 36.73 days
Financial Analysis Faulkender Company Comparative Balance Sheet December 31, 2009 and 2008 20092008 Cash $ 22,000 $ 20,000 Accounts receivable 41,500 39,000 Inventory 72,000 64,000 Plant and equipment 288,000 265,000 Accumulated depreciation (80,000) (72,000) Total assets $343,500$316,000 Accounts payable $ 24,000 $ 37,000 Wages payable 3,500 4,000 Taxes payable 6,750 8,500 Bonds payable 100,000 100,000 Common stock 80,000 80,000 Retained earnings 129,25086,500 Total liabilities and stockholder’s equity $343,500$316,000 ________________________________________________________________________ Faulkender Company Income Statement For the Year Ended December 31, 2009 Sales $400,000 Cost of goods sold 248,000 Gross margin $ 152,000 Operating expenses: Selling expenses $39,000 Rent expenses 45,000 Depreciation expense 11,000 Bad debt expensee 1,715 Interest expense 15,000 111,715 Income from operations $ 40,285 Loss on sale of equipment (1,000) Income before taxes $ 39,285 Income tax expense 11,785 Net income $ 27,500 Inventory turnover: cost of sales / average inventory $248,000/ ([$64,000+ $72,000]/2 = 3.6471 times Days in the selling period: 365 /3.6471 = 100.08 days
Length of Operating Cycle Days in selling period plus days in collection period Or, in other words - Length of time between when a company purchases items for inventory and when it receives payment for sale of the items. A long operating cycle tends to harm profitability by increasing borrowing requirements and interest expense.