Download
1 / 29
290 likes | 296 Views
Analysis of the centromere organization in the nucleus of human stem cells. Egge van der Poel Bachelor Student TU Delft. Contents. Aim and Relevance Materials Methods Results. Aim and Relevance. To write an algorithm to analyze the 3D-distribution of centromeres. Aim and Relevance. ?.

E N D
Analysis of the centromere organization in the nucleus of human stem cells Egge van der PoelBachelor Student TU Delft
Contents • Aim and Relevance • Materials • Methods • Results
Aim and Relevance • To write an algorithm to analyze the 3D-distribution of centromeres
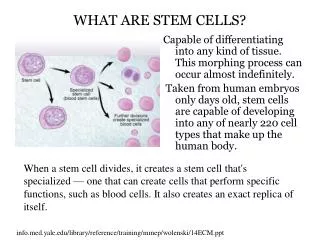
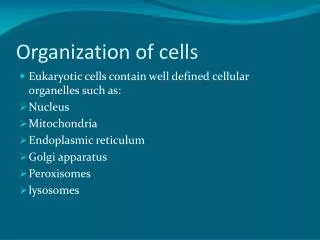
Materials • Obtaining specimen: human mesenchymal stem cells (hMSCs) expressing CenPA-GFP • Imaging: confocal microscope; allowing stepping through a cell creating a series of 2D-images • Analysis: Matlab DipImage Teloview • Writing algorithm as a Matlab file (.m-file)
Methods • Data collection with Teloview • Segmentation: thresholding • Noise removal: erosion & dilation • Obtaining coordinates of centromeres • Calculating distances to center of mass • Obtaining distribution • Plot: distribution-histogram and 3D cell-representation
Methods 2. Segmentation: thresholding
Methods • Three threshold-methods • Isodata • Triangle • Twice Averagethreshold value = 2*(average intensity of image)
Methods • Isodata: iterative technique • set threshold value T0 • calculate mean of ‘background’ (MB) and ‘objects’ (MO) • calculate mean of total (i.e. MB and MO) (MT) • compare MT with T0: if MT is not equal to T0 set new treshold value T1 = MT and start over • Repeat untill the mean of total is equal to threshold value
Methods • Triangle: not iterative, starts with histogram of image
Methods • Noise removalwe assume ‘centromeres’ are larger than ‘noise’ and want to dispose of the small noise objects this assumption is okay for good quality images (where size ‘noise’ << size ‘centromeres’) • Binary erosion: converts a binary ‘1’ to a binary ‘0’ if this ‘1’ is connected, in a way specified by the connectivity, to a binary ‘0’This erodes out the smaller objects and can be repeated to erode out increasingly large objects Small objects are out but large objects are smaller than before
Methods • Binary dilation (opposite of binary erosion):converts a binary ‘0’ to a binary ‘1’ if this ‘0’ is connected, in a way specified by the connectivity, to a binary ‘1’Restores the ‘centromeres’ to their original sizeConnectivity?2D: 4-connected vs 8-connected (figure)3D: 6-connected vs 26-connected
Methods • An extra erosion step (followed by an extra dilation step) can be taken by the user to increase the strictness of the algorithm
Methods • Obtaining coordinates of centromeres • Measuring coordinates of centromeres: the function measure available in DipImage finds voxelsize and coordinates of the centromeres • Calculating center of mass:
Methods • Calculating new coordinates, relative to center of mass • Normalization of new coordinatesWhy? Shape of nucleus is more an ellipsoid than a sphere; without normalization the calculation of the distance would ‘neglect’ the z-coordinate (<< x- and y-coordinate):
Methods How? Normalization factor (di) is different for two cases • No lamin taken into account: di = standard deviation of i-coordinates • With lamin taken into account:edges of lamin are detecteddi = ½ * (maximum of i-edge - minimum of i-edge) After normalization all axes are weighed equally
Methods Note on approximation with lamin taken into account: on average, underestimates and overestimates of distances cancel (di=) Ri = estimated ellipsoid radius of i-axis
Methods • Calculating distances to center of mass • Obtaining distributionthe resulting distances are divided into an amount of classes (shells with increasing radius) specified by the usermaximum distance = without lamin: distance of most outwards orientated centromere with lamin: radius of normalized (spherical) nucleus = 1
Methods The number of centromeres per class (shell) is counted this number is then divided by the volume of the class to obtain the number of centromeres per unit volume, nthe relative frequency, nrel, of this last number is what is plotted in the distribution histogram
Methods • Plot: distribution-histogram
Methods • Plot: 3D cell-representation
Methods • Finally the data is written to ‘results_centromeres’* in the Matlab working directory or directly written in a matrix in Matlab* file extension can be chosen .txt or .xls • Data = [ID-tag voxelsize x-coord y-coord z-coord distance]
Methods • Data collection with Teloview • Segmentation: thresholding • Noise removal: erosion & dilation • Obtaining coordinates of centromeres • Calculating distances to center of mass • Obtaining distribution • Plot: distribution-histogram and 3D cell-representation
Results • Without lamin taken into account + change in orientation of distribution is visible ̶ distribution does not show relation to the edge of the nucleus • With lamin taken into account + orientation can be related to the edge of the nucleus
Results: PS4 Without lamin taken into account change in orientation is visible
Results • Three different thresholding techniques are compared using a Wilcoxon Signed Rank Test with a significance level of 5% if 0.05 < p < 0.95 then equal distribution