Download
1 / 52
520 likes | 528 Views
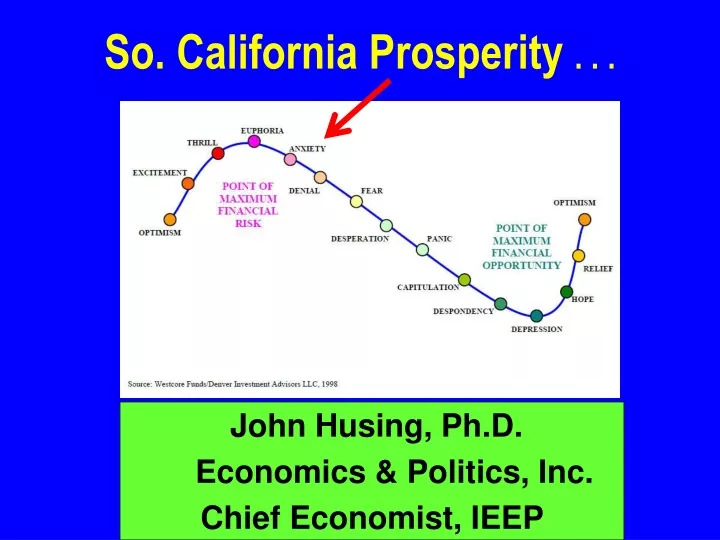
So. California Prosperity. John Husing, Ph.D. Economics & Politics, Inc. Chief Economist, IEEP. U.S. Jobs Still Setting Records. 17.9%. Add Potential Workers: Given Up Or Part Time. 10.1%. 6.9%. 3.6%. Inflation: NOT MUCH!. 3.3%. 2.0%. Interest Rates:.

E N D
So. California Prosperity . . . John Husing, Ph.D. Economics & Politics, Inc. Chief Economist, IEEP
17.9% Add Potential Workers: Given Up Or Part Time 10.1% 6.9% 3.6%
Inflation: NOT MUCH! 3.3% 2.0%
Interest Rates: A Short Term Rate Decrease? 4.12% 2.50%
Yield Curve: Potential Recession Predictor Recession: 2020 Likelihood An Issue 2 Year to 10 Year 0.22%
Four Southern County Economy Gaining Strength! 2011-2018 Add +1,212,300 Jobs 8.3% Above 2007 Level 2008-2010 Lost -625,500 Jobs
Unemployment Rates March 2019
Gold Mine Theory Secondary Tier Primary Tier
E-Commerce 14.5%
Logistics Powerful Job Growth • 2011-2018 • 13.2% of New Jobs
CA Electrical Cost +88.0% +127.8%
Manufacturing Jobs • 2011-2018 • -0.9% of Job Growth
Net Industrial Absorption 21.9 million
Industrial Rates & Vacancies Lease Rates Per Square Foot Per Month, March-2019 Central Valley $0.46 6.0% Inland Empire $0.58 3.6% Ventura $0.87 1.5% Los Angeles $0.88 1.4% Orange $0.92 2.4% San Diego $0.98 4.2% Source: CB Richard Ellis
New Home Sales Volumes -35.2% -35.2% -34.1% -29.8% -47.8%
Existing Home Sales Volumes -14.0% -12.9% -9.4% -5.3% -18.0% -16.9%
Professionals & Mgmt., Higher Ed., Utilities, Information & Government 2011-2018 13.5% of Growth
Construction Jobs • 2011-2018 • 10.3% of Job Growth
Health Care Jobs: Continuous Growth • 2011-2018 • 12.0% of Job Growth
Population Serving Sectors E-commerce death High End Consumers Still Doing Well 3rd Strongest Inland Sector
Retail Jobs: An Issue • 2011-2018 • 15.5% of Job Growth • 2011-2018 • 6.1% of Job Growth