Download

1 / 16
160 likes | 165 Views
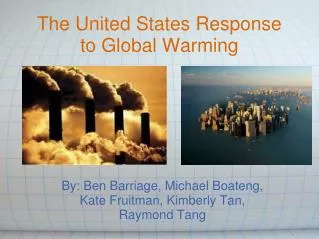
Simulation of Global Warming in the Continental United States Using Agent-Based Modeling. By Marika Lohmus. Purpose. What is the relationship between population and global warming? More people → more greenhouse gases More greenhouse gases → higher temperatures

E N D
Simulation of Global Warming in the Continental United States Using Agent-Based Modeling By Marika Lohmus
Purpose • What is the relationship between population and global warming? • More people → more greenhouse gases • More greenhouse gases → higher temperatures • Higher temperatures → less people Population size Greenhouse gases Temperature Figure 1: Negative Feedback Loop
Purpose Cont. • With a negative feedback loop, there should be an oscillating representation of the temperature and population size which should level off. • When, at what temperature and at what cost?
1st Quarter Work • NetLogo • Got elevation data from previous project • Started Temperature map • Took me most of 1st quarter Fig 2: Q1 Temperature Map Fig 3: Elevation Map
2nd Quarter • Concentration: • Temperature • System Dynamics • Agents • Patches • Turtles • People • Cities
People Salary 1/10,000 Cities Median Salary Poverty percent Name Agents • Patches • Elevation • Temperature • Death-rate • Birth-rate • Turtles • Act as borders • Negative values
Patches • Change color as elevation or temperature changes • Color determined by change in average global temperature Fig 5: Temperature Increase
Another random number generated to determine whether the agent will move or not Looks better – otherwise people stay in one place People • Turtle-like agents • Human shape • Random number generated for each – birth rate and death rate per 10,000 people per year
Total greenhouse gas emissions determined by population size # Factories increase as population increases Assumption • Total population of the united states = population of all the largest cities • Everyone lives in large cities • Everyone has an equal effect on greenhouse gas output
3rd Quarter • Finished Coding • Designed Interface • BehaviorSpace for data
Current Results Figure 7: Temperature and Population Data
Variables • D_R • The death rate changes as temperatures and sea levels increase • Infection diseases, drowning, heat stroke, etc. • By how much? • Technology determines D_R
Variables (Cont.) • Birth Rate • Assuming that brith rate remains constant (.1418) • Will it change in the future and by how much?