Download
1 / 147
1.48k likes | 1.8k Views
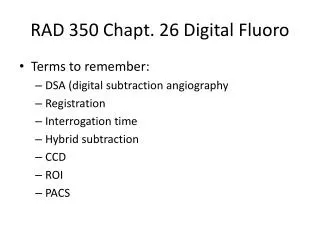
RHB FLUORO SYLLABUS. DATA EXCERTS Created 2008 RT 244 wk 4 / RT255 Review. Ch 1 – pg 1 5% population have fluoro exams 53% GI tract (1996 ) 120 sec fluoro ~= ese 5 – 15 rads Comp to ABD ~= ese 100- 500 mrads Fluoro used for dynamic studies

E N D
RHB FLUORO SYLLABUS DATA EXCERTS Created 2008 RT 244 wk 4 / RT255 Review
Ch 1 – pg 1 • 5% population have fluoro exams • 53% GI tract (1996 ) • 120 sec fluoro ~= ese 5 – 15 rads • Comp to ABD ~= ese 100- 500 mrads • Fluoro used for dynamic studies • USING FLUORO TO POSTION PATIENTS PRIOR TO TAKING FILM IS PROHIBITED • Must have fluoro permit or Supervisor & Operators Certificate from state
Ch 2 - review all outlined • Inc factors directly influencing dose: • Ma, Fluoro (0.5 – 5 ) (usually 1 – 3 ma) • Spot film ma (100 – 200) • Kvp ( 80 -130) FOR FLUORO • collimaiton ALWAYS SMALL AS POSSIBLE • Filtration 3.0 mm AL for 125-150kvp • time, (less is better) – 5 Min audible alarm • Doubling time = doubling exp to patient • Pulsed fluoro vs continuous • Image receptor speed (FASTER) • 8:1 grid ratio fluoro
Ch 2 • LIH or last image hold • High kvp / low ma • Lower frame rate • Long tube to patient distance • 18 “ preferred in stationary (15” minimum) • Mobile – 12” minimum • Short II to patient distance • moving II 12 to 18 “ away ↑ dose by (30-45%) • Dead Man Switch – foot pedal
ALLOWABLE EXPOSURE RATES • Before 1974 w/o AEC = 5R/min • After with AEC • Regular mode = 10 R/ hr • BOOST/MAG mode = 20 R/hr • The table top intensity should not exceed 2.2 R/min for each mA of current at 80 kVp • ROOM LIGHTING • Ambient light low – see image better – less pt dose • Bright light reduced eye to resolve detail • Otherwise increasing kvp/mas will increase pt dose
II – 2mm lead equiv = Primary Barrier • Interlocked – prevents exposure when parked • SHIELDING requirements (pg 5) • BUCKLY SLOT COVER – .25 mm lead • bucky moved to end of table • CURTAIN – in place .25 mm lead • w/o dose can be 500 mrads/hr to operator • Not requried on c-arm mobile units
BUCKY SLOT COVER .25 MM LEAD
Image intensifiers – reduces pt dose • Review parts & function • BG = MG x FG • Quantum Mottle (not enough photons) • Blotchy, grainy appearance • Caused by too little exposure • Most commonly remedied by increasing mA
Units of measurement • INPUT PHOSPHOR – IS MEASURED IN _________________________________ • OUTPUT PHOSPHOR IS MEASURED IN • ______________________________
BG = MG X FG • FLUX GAIN – increase of light brightness due to the conversion efficiency of the output screen • 1 electron = 50 light photons is 50 FG • Can decrease as II ages • Output phosphor almost always 1 inch • Zinc cadnium phosphot • Flux gain is almost always 50
VACUUM TUBE ENCASED IN A LEAD HOUSING = 2MM PB (PRIMARY BARRIER) Image Intensifier
Contrast • Contrast – • Subject – changed by contrast media (PE) • Equipment (camera tube, settings on monitor) • Controlled by amplitude of video signal • Affected by: • Scattered ionizing radiation • Penumbral light scatter
Resolution • 525 line TV (old) 1024 (newer digital) • Ability to resolve objects (detail) • Measured in lp/mm • MTF – expression of resolution for imaging system (modulation transfer function) • Distortion – size, shape (pg 9) • PINCUSION may comprise 8 – 10 % of image area
Image distortion PINCUSHION EFFECT
Size Distortion • Affected by same parameters as static radiography • Primarily OID • Can be combated by bringing image intensifier as close to patient as possible
Shape Distortion • Geometric problems in shape of input screen • Concave shape helps reduce shape distortion, but does not remove it all • Vignetting or pin cushion effect
Pg 9 • LAG – blurring occurs from moving II too quickly – can’t capture photons • (amt of time for camera tube to capture) • VIGNETTING – fall off of brightness at periphery of image = loss of brightness • II TUBES = MULIT MODE • BI FOCUS (2 sizes) TriI (3 sizes) • Smaller surface area= MAG MODE • ↓ suface area ↑ mag = ↑ patient dose • II ~= 4 lp/mm Mag ~= 6 lp/mm
Intensifier Format and Modes Note focal point moves farther from output in mag mode
Pg 9 • TV – closed circuit system via video cables • TV CAMERA/ PICK UP TUBES: • VIDICON • PLUMBICON • IMAGE ORTHOCON • TRANSFERS IMAGE FROM OUTPUT PHOSPHOR TO TV MONITOR • CONNECTED BY FIBER OPTICS
TV camera and video signal (II) • VIDICON tube uses antimony trisulphide • PLUMBICON tube made out of lead oxide,
VIDEO/CAMERA TUBE • VIDICON MOST COMMOM • LOWEST PATIENT DOSE • PLUMICON – BETTER RESOLUTION • ORTHOCON – VERY $$$$ • BEST RESOLUTION … but…. • (II & camera tube combined (not used)
Type of TV camera • VIDICON TV camera • improvement of contrast • improvement of signal to noise ratio • high image lag • LOWER PATIENT DOSE • PLUMBICON TV camera (suitable for cardiology) • lower image lag (follow up of organ motions) • higher quantum noise level • CCD TV camera (digital fluoroscopy) • digital fluoroscopy spot films are limited in resolution, since they depend on the TV camera (no better than about 2 lp/mm) for a 1000 line TV system
TV CAMERA TUBE – • 525 = TOTAL # OF SCAN LINES
Basic Componets of “old” Fluoroscopy “Imaging Chain” Primary Radiation EXIT Radiation Fluoro TUBE PATIENT 105 Photospot Image Intensifier Image Recording Devices ABC Cassette Fiber Optics OR CINE CONTROL UNIT VIDICON Camera Tube TV
PG 10 • CAMERA CONTROL UNIT • Synchronizes the video signal between camera & monitor • TV –MONITOR • CRT – Cathode Ray Tube • Much larger than camera tube – but similar function • The electrons are synchronized by the control unit – so they are of the same intensity and location as the electrons generated by the pick up (camera) tube
CINE/ CINEFLUORGRAPHY PG 10 • Synchronized with camera shutters – no exp while closed • Movie camera intercepts image • 16 mm and 35 mm formats • Record series of static exposures at high speed • 30 – 60 frames per second • Offer increased resolution • At the cost of increased patient dose • FRAMING FREQUENCY • Division of 60 (7.5,15,30,60,90,120) • ↑# frames ↑ patient dose • 2mr/frame ~30f/sec
VIDEO DISC RECORDING • (like a laser disc – size of an LP record ???) • Combines radiography with fluoro • Image is stored as a single frame on a video disc recorder - newer uses CD • 95% dose reduction when utilizing video disc recording during fluoro • VIDEO TAPE RECORDING • Provides a permanent record w/o ↑ pt dose • Instant play back - Real time images • Poor image quality
SPOT FILMS – CASSETTESPG 11 • BETWEEN PT & II • ↑ Ma (100 -200) ↓ time • High resolution • PHOTOSPOT – • ½ - 1/3 DOSE OF FILM CASSETTES • TAKEN FROM OP OF II • ↑ Ma , ↓ time (LESS THAN CASSETTE) • ↓ image quality than cassettes
CASSETTE SPOT FILMINGvs PHOTOSPOT FILMING • First type of recording used • 9x9 cassettes then later up to 14x 14 • 9 on 1, 4 on 1, 2 on 1 • Delay while filming (anatomy still moving) • Radiographic mA - must boost up to • 100 – 200 mA for filming • And moving cassettes around inside tower • Higher patient dose • Replaced by Photospot (f/sec) filming
CASSETTE SPOT FILMINGvs PHOTOSPOT FILMING • Photospot (f/sec) filming – • Set at control panel from 1 f/sec – 12 f/sec • Used for rapid sequence: • Upper Esophogram • Voiding Cystourethrograms (Peds) • Lower patient dose
ACCESSORIES – • GONAD SHILEDS – 0.5 MM PB • GRIDS - 8:1 RATIO • CASSETTES – front – low z# • Higher speed = lower pt dose = lower resolution
PATIENT (BODY) = Scatter to RT DOSE influenced by: Physique Pathology Habitus Type of tissue exposed Tissue density REMNANT RADITIATION hits II (review ESE – tube, II)
EQUIPMENT REVIEW • PG 16 – 26 • REVIEW OF FORMULAS TO KNOW:
Intensifier Performance Conversion factor is the ratio of output phosphor image luminance (candelas/m2) to x-ray exposure rate entering the image intensifier (mR/second). • Very difficult to measure: no access to output phosphor • No absolute performance criteria
Intensifier Brightness Gain (BG) BG = Minification Gain x Flux Gain • mG = (Input Diameter )2 (Output Diameter)2
Intensifier Brightness Gain • Flux Gain (FG): Produced by accelerating the photoelectrons across a high voltage (>20 keV), thus allowing each electron to produce many more light photons in the output phosphor than was required to eject them from the photcathode. • Summary: Combining minification and flux gains:
MAG MODE FORMULA IP OLD SIZE IP NEW SIZE = %mag
PT dose in MAG MODE IP OLD SIZE 2 IP NEW SIZE 2 = ↑pt dose
The image intensifier (I.I.) I.I. Input Screen Electrode E1 Electrode E2 Electrode E3 Electrons Path I.I.Output Screen Photocathode +
kV X Ray TUBE PM REFERENCE kV FILM CONTROLLER VIDICON GENERAL SCHEME OF FLUOROSCOPY
vignetting • Falloff of brightness at edges of TV screen • Unequal mag can cause unequal illumination • Center of screen is brighter than periphery • Resolution is also better in center End of Wk 4 RHB review
PG 23 • VEILING GLARE • Scatter in the form of x-rays, light & electrons can • reduce contrast • of an image intensifier tube.
PG 23 • ABC • Automatic brightness control allows Radiologist to select brightness level on screen by ↑ kVp or ↑ mAs • Automatic dose control • Located just beyond the Output Phosphor • Will adjust according to pt thickness
Automatic Brightness Control • Monitoring Image Brightness • Photocell viewing (portion of) output phosphor • TV signal (voltage proportional to brightness) • Brightness Control: Generator feedback loop • kVp variable • mA variable/kV override • kV+mA variable • Pulse width variable (cine and pulsed fluoro) • less dose with pulsed vs continous fluoro