Download
1 / 16
160 likes | 274 Views
Numerical Study of Influence of Mountain Ranges in Taiwan on a cold Front by Wen-Yih Sun National Center for High Performance Computing Hsin-chu, Taiwan and Jiun-Dar Chern Laboratory for Atmospheres, NASA Goddard Space Flight Center Greenbelt, MD 20771, USA ICMCS-V Oct. 31-Nov. 3, 2006.

E N D
Numerical Study of Influence of Mountain Ranges in Taiwan on a cold Front by Wen-Yih Sun National Center for High Performance Computing Hsin-chu, Taiwan and Jiun-Dar Chern Laboratory for Atmospheres, NASA Goddard Space Flight Center Greenbelt, MD 20771, USA ICMCS-V Oct. 31-Nov. 3, 2006
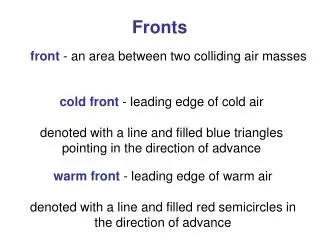
x x Isochrones of the leading edge of the cold air determined from the surface and satellite data. The designator hhZdd is used to denote the UTC hour (hh) and the day (dd) in June 1987. (After Chen and Hui, 1990)
Pre. Grad. (∆x ≈ 30 - 40 km) ≈ 6.5 - 8.7 10-4m s-2, Coriolis f (≈ 6 x 10 -4m s-2). Fig. 1b: Wind component parallel to the front (solid) and cross-front wind component (dashed) from P-3 aircraft data. (After Chen and Hui, 1990)
Inviscid without f Density current Sun and Chern, 2006. JMSJ,, Vol. 84. pp. 27-46
A’ B’ B A Initial condition: ECMWF surface v & V at 0000UTC14 June 1987
EC PRM wind vector and streamline at 06Z15 June 1987 at z=25m
hpa hpa 80 80 200 200 400 400 600 600 800 800 1000 1000 EC PRM A A’ A A’ Vertical cross section along AA’ for v & cross-front wind component at 06Z15 June 87
B’ B’ B B Vertical cross section along BB’ for v & cross-front wind component at 06Z15
the ageostrophic forcing (–7.8 x 10⁻⁴ m s-2), advection term (-6.7 x 10⁻⁴ m s -2), and friction (-9.0 x 10⁻⁴ m s-2) are comparable in CONTROL case in the lower PBL speed of density current With ∆Tv= 1 K, H= 800 m, and =1.1, CH obtained 5.5 m s-1 Kelvin shock wave is: The propagation speed of the simulated frontal leading edge along AA’ was about -2.8 m s-1 between 1800 UTC 14 and 0600 UTC 15, which is comparable with the ECMWF analysis, but much slower than ~ 6 m s-1 estimated by CH.
30N 120E Wind and v at 00Z15 June 1987 for INVISCID Case
Wind and v at 12Z15 June 1987 for INVISCID and without mountains in Taiwan