Download
1 / 51
550 likes | 753 Views
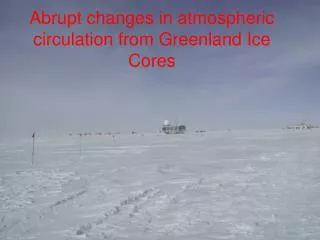
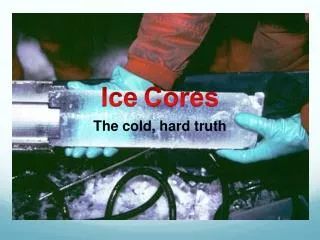
Ice Cores. Very important paleoclimatic archives. Records of past atmospheric conditions. Temperature Humidity Snow accumulation Atmospheric composition Volcanic activity Tropospheric turbidity Wind speed, wind direction Atmospheric circulation. Ice Core drilling.

E N D
Ice Cores • Very important paleoclimatic archives. • Records of past atmospheric conditions. • Temperature • Humidity • Snow accumulation • Atmospheric composition • Volcanic activity • Tropospheric turbidity • Wind speed, wind direction • Atmospheric circulation
Stable Isotopes-Concepts • Name Symbol Definition • Atomic number Z # protons (p+) • Neutron number N # neutrons (n) • Mass number A # p+ + n
Isotope effect and fractionation • Isotopes undergo the same chemical and physical reactions. • The rate of these reactions, however, could be different (isotope effect), resulting in the partitioning of isotopes (fractionation).
Terminology d=1000(Rsample/Rstandard – 1) where R=heavy isotope/lighter isotope d18O= 1000(18Rsample/18Rstandard – 1) where 18R=18O/16O dD= 1000(2Rsample/2Rstandard – 1) where 2R=D/H Standard is V-SMOW (Vienna-Standard Meteoric Ocean Water). d18OV-SMOW = dDV-SMOW = 0‰
Temperature Altitude Distance from the source Latitude IAEA (2001). GNIP Maps and Animations.
d-excess • Meteoric Water Line: dD=8*d18O+10 d-excess under “normal” conditions d= dD-8*d18O Increased relative humidity or lower sea-surface temperature (reduced evaporation rates) produces lower d-excess values.
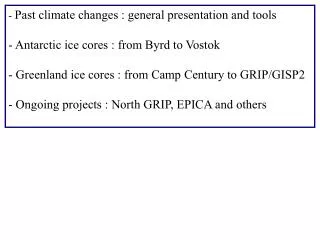
Dating Ice Cores • Radio-isotopes • Ice layers • Ice flow models • Reference horizons
Volcanic markers provide additional time control
Seasonal variations can be detected with microparticles and glacio-chemical data
MIS-4 MIS-1 MIS-3 MIS-5 Blunier and Brook, 2001, Science
Colder/Drier? Warmer/Wetter?