Download
1 / 24
260 likes | 461 Views
BIT 815: Analysis of Deep Sequencing Data. Overview:

E N D
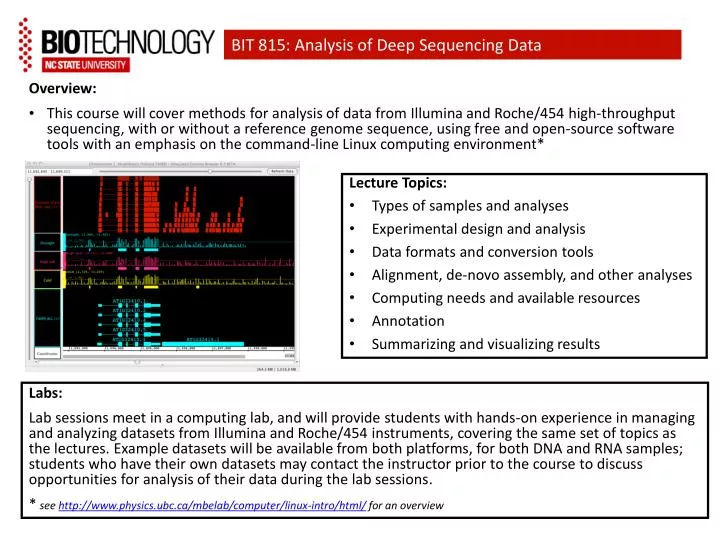
BIT 815: Analysis of Deep Sequencing Data • Overview: • This course will cover methods for analysis of data from Illumina and Roche/454 high-throughput sequencing, with or without a reference genome sequence, using free and open-source software tools with an emphasis on the command-line Linux computing environment* • Lecture Topics: • Types of samples and analyses • Experimental design and analysis • Data formats and conversion tools • Alignment, de-novo assembly, and other analyses • Computing needs and available resources • Annotation • Summarizing and visualizing results Labs: Lab sessions meet in a computing lab, and will provide students with hands-on experience in managing and analyzing datasets from Illumina and Roche/454 instruments, covering the same set of topics as the lectures. Example datasets will be available from both platforms, for both DNA and RNA samples; students who have their own datasets may contact the instructor prior to the course to discuss opportunities for analysis of their data during the lab sessions. * see http://www.physics.ubc.ca/mbelab/computer/linux-intro/html/ for an overview
Introduction to the course and to each other • - background in biology, computing, and sequencing • - experiments of interest to participants • Course structure • - 3 two-hour blocks per week • * ~ 45 min lecture/discussion • * ~ 70 min lab exercises • - some assigned reading • - participation in classroom discussion is expected • - no exams • Course Objective • - to teach you how to teach yourself
The sequencing rate is growing faster than Moore’s Law Stein (2010) Genome Biology 11:207
DNA sequencing costs Based on data from https://www.genome.gov/sequencingcosts/
Sequence data analysis is changing rapidly • - relatively few methods are completely static • - much of the software is still under active development • - new methods and tools are reported every month • - staying on the learning curve is essential • Why use Linux for sequencing data analysis? • - it is well-suited to the task • * preferred development platform for most tools • * modular design • * however … it’s built for speed, not for comfort
Modular design in Linux – a ‘toolbox’ approach • Individual components of the Linux operating system are written as separate programs • Different programs can have similar functions • A Linux “distribution” is a collection of programs that work together as an operating system • Users have the power to add new programs, or take away existing programs that are not being used, to optimize system performance
Why is modularity an advantage? • - adding new software is relatively straightforward • - the operating system can be continually upgraded • - adding tools to the toolbox is easy • - staying on the learning curve is essential • There is always more than one way to do it • - some sequence analysis tasks have matured to stability • - most have not, and are still changing • - ‘best practices’ are also changing, and subject to dispute
Linux distributions • - collections of ‘tools’ targeted to different user groups • - some are commercial, most are not • - five or six distributions account for most of the users • - many dozens of variants available, mostly of minor interest • Which to use for sequencing data analysis? • - Ubuntu • * widely-used distributionwith good hardware support • * base for Bio-Linux, with pre-installed bioinformatics packages • * Bio-Linux is also available as an Amazon EC2 machine image for cloud computing • * “Lubuntu” is Ubuntu with the Lightweight X Desktop Environment (LXDE) instead of the Gnome desktop
Amazon Web Services • - A commercial resource for computing infrastructure • - provides access to ‘virtual machines’, or VMs, for users • - a VM is an ‘instance’ of a ‘machine image’ • - the underlying image is the same for every instance • - user-generated files are lost when the instance terminates • Using AWS for data analysis • - Cloudbiolinux is a machine image (built on Ubuntu) with bioinformatics programs pre-installed and configured • - A laptop or desktop is used as a terminal • - Connection is through Secure SHell (SSH), using PuTTY • - A graphical interface is available through NX Client • - Data storage in the AWS cloud is available for a price • - Data transfer into the cloud is free, but data transfer out is not
Sequencing technology overview • - Two different systems on campus: Illumina, Ion Torrent • - A similar overall strategy for highly-parallel sequencing • - Different approaches taken at virtually every step • - These different platforms produce data with different characteristics • - Other platforms are available off-campus, but are not a focus of the course • Similarities • - DNA molecules are fragmented and ligated to adaptors • - individual DNA molecules are immobilized on a surface • - a series of nucleotide addition reactions are carried out • - the nucleotide added is detected after each addition • - a data file is produced containing the DNA sequences of many fragments
Sequencing technology overview (Video from Life Technologies) Video link
Sequencing technology overview TACG ‘key’sequence Image from http://en.wikipedia.org/wiki/Ion_semiconductor_sequencing
Sequencing technology overview Increasing numbers of the same nucleotide in a row cause increasing variation in the pH signal, leading to uncertainty about the exact number of bases incorporated. This leads to a higher proportion of insertion-deletion errors in Ion Torrent data than in Illumina data, but a lower proportion of substitution errors
Sequencing technology overview – Illumina Illumina uses a glass ‘flowcell’, about the size of a microscope slide, with 8 separate ‘lanes’. The HiSeqinstrument scans both upper and lower surfaces of each flowcelllane.
Sequencing technology overview – IlluminaGAIIx Fragment DNA, ligate adaptor oligos Single-stranded DNA binds to flowcell surface
Sequencing technology overview – Illumina Surface-bound primers are extended by DNA polymerase across annealed ssDNA molecules,the DNA is denatured back to single strands, and the free ends of immobilized strands annealagain to oligos bound on surface of flowcell. This ‘bridge PCR’ continues until a cluster of~ 1000 molecules is produced on the surface of the flowcell, all descended from the singlemolecule that bound at that site. After PCR, the free ends of all DNA strands are blocked.
Sequencing technology overview – Illumina Another perspective of the amplification process, showing the clusters of products
Sequencing technology overview – Illumina Although four different colors are used for the fluorescent nucleotides, only two lasers are used to excite the fluorescence. The fluorescent labels are grouped in pairs - labels on A and G are excited by one laser, and labels on C and T are excited by the other laser. This means that distinguishing between the A signal and the G signal is more difficult for the instrument than A versus C or A versus T. Base substitution errors are the most common type of sequencing error for Illumina instruments. AGCCG TAAGT GCTGA CTTAG
Illuminaflowcell geometry (HiSeq) 1 2 3 4 5 6 7 8 A flowcell has 8 lanes, which are physically separated. Each surface (upper and lower) of each lane is imaged during each cycle of sequencing in 3 separate “swaths”, and 16 images or ‘tiles’, are collected from each swath, for a total of 96 tiles per lane. The swaths and tiles are not physically separated. Tiles within a lane are numbered from 1 to 16 down (from outflow end to inflow end), and swaths are numbered from left to right. 1 1 1 The top surface is 1, and the bottom surface is 2. Each tile ID is expressed as a 4-digit number, organized as Surface-Swath-Tile [12] [123] [01..16] 2 2 2 15 15 15 16 16 16 http://seqanswers.com/forums/showthread.php?t=19259
Sequence data output format • DNA sequence data are typically provided with “quality scores”, either as paired files or combined in a FASTQ file • In separate files, DNA sequences are in FASTA format and quality scores are numbers from 0 to 40 • >FQSOZHZ01ASD8U rank=0159502 x=206.0 y=1164.5 length=65 • TACCTCTCCGCGTAGGCGCTCGTTGGTCCAGCAGAGGCGGCCGCCTTCGTCGCGAGCAGAATAGG • and>FQSOZHZ01ASD8U rank=0159502 x=206.0 y=1164.5 length=65 • 37 28 28 28 37 37 37 28 28 28 37 39 36 33 33 33 37 37 40 40 39 39 39 39 39 39 40 40 39 39 39 39 39 39 40 38 37 37 35 35 35 33 33 23 23 23 19 17 19 21 21 17 17 17 19 17 19 14 14 12 12 14 16 12 12 • In a FASTQ file, DNA sequences look similar, butquality scores are encoded as single textcharactersratherthan as numbers • @FQSOZHZ01ASD8U rank=0159502 x=206.0 y=1164.5 length=65 • TACCTCTCCGCGTAGGCGCTCGTTGGTCCAGCAGAGGCGGCCGCCTTCGTCGCGAGCAGAATAGG+ • F===FFF===FHEBBBFFIIHHHHHHIIHHHHHHIGFFDDDBB88842466222424//--/1-- http://en.wikipedia.org/wiki/FASTA_format and http://en.wikipedia.org/wiki/FASTQ_format
Understanding FASTQ formator “what do all these symbols mean?” See http://en.wikipedia.org/wiki/FASTQ_format for more details Instrument ID lane tile X Y barcode read# Header lines sequence quality scores • Quality scores are numbers that represent the probability that the given base call is an error. • These probabilities are always less than 1, so the value is given as 10 times minus log(10) of the probability • For example, an error probability of 0.001 (1x10⁻³) is represented as a quality score of 30. • The numbers are converted into text characters so they occupy less space – a single character is as meaningful as 2 numbers plus a space between adjacent values
Understanding FASTQ format Illumina v1.8 header version: @EAS139:136:FC706VJ:2:2104:15343:197393 1:Y:18:ATCACG Instrument /flowcell ID lane tile X Y barcode read# Header lines sequence quality scores Unfortunately, at least four different ways of converting numbers to characters have been used, and header line formats have also changed, so one aspect of data analysis is knowing what you have.