Download
1 / 7
70 likes | 186 Views
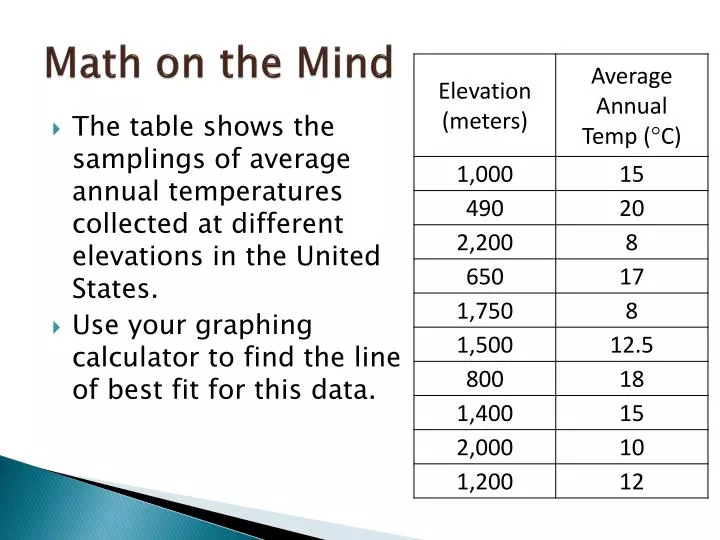
Math on the Mind. The table shows the samplings of average annual temperatures collected at different elevations in the United States. Use your graphing calculator to find the line of best fit for this data. Math on the Mind.

E N D
Math on the Mind • The table shows the samplings of average annual temperatures collected at different elevations in the United States. • Use your graphing calculator to find the line of best fit for this data.
Math on the Mind • Does your screen display an “r” value along with the “a” and “b” values? • If not, • Press “2nd” and “0” to get to the Catalog. • Press “x-1” to get to the “D” menu. • Scroll down to “DiagnosticOn” and press “Enter”.
Correlation Coefficient Unit 8, Day 5
Correlation Coefficient (r) • r measures the strength of the relationship between the variables. • r is between -1 and 1. • The closer r is to 0, the weaker the correlation. • The closer r is to 1 or -1, the stronger the correlation.
Find the Correlation Coefficient of the Following Data: • The table below represents the number of powerboats registered in the given year.
Number of Households in the U.S. Households (millions) Year 1975 71.1 1980 80.8 1985 86.8 1990 93.3 1995 99.0 [Source: U.S. Census Bureau, Current Population Reports. From Statistical Abstract of the United States, 2000] Scatter Plots and Equations of Lines of Best Fit 1. Write an equation for the trend line. 2. Predict the number of households in the U.S. in 2005. (Use 105 for x.) 3. What is the correlation coefficient? y = 1.366x – 29.91 about 112.8 million households 0.9943767027