Download
1 / 39
390 likes | 489 Views
Comprehensive guide for evaluating a levee segment, covering hydraulics, foundation, ratings, risk factors, and recommendations. Customize the presentation to suit the specific segment. Utilize visuals and tables effectively.

E N D
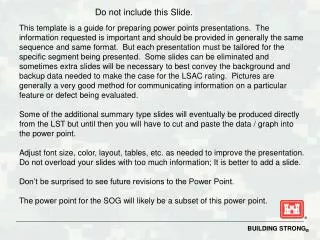
Do not include this Slide. This template is a guide for preparing power points presentations. The information requested is important and should be provided in generally the same sequence and same format. But each presentation must be tailored for the specific segment being presented. Some slides can be eliminated and sometimes extra slides will be necessary to best convey the background and backup data needed to make the case for the LSAC Assignment. Pictures are generally a very good method for communicating information on a particular feature or defect being evaluated; captions for photos should be provided. Some of the additional summary type slides will eventually be produced directly from the LST but until then you will have to cut and paste the data / graph into the power point. Adjust font size, color, layout, tables, etc. as needed to improve the presentation. Do not overload your slides with too much information; It is better to add a slide. Don’t be surprised to see future revisions to the Power Point. The power point for the SOG will likely be a subset of this power point.
Presenter Name: Presenter Title: <Add Title> Duty Location: <Add Location> Date of Presentation: NLD System: NLD Segment: Name of Levee Segment
Levee Overview • USACE District • Name of Segment • Identify Segments relationship to Levee System (Does Segment = System, or is it only a part of a bigger system.) • Segment ID from NLD • Authorization / Project • Identity of Owner Operator • Dates of Construction (year) • Population at Risk Day: xxxx , Night: xxxx
Vicinity/Segment Map EXAMPLE
Summary of Hydraulics Remove example and replace with graphic of levee, water surface elevations, and house along with the legend from Levee Information tab for the subject screening here. • Hydraulics • Toe and Overtopping ACE • Max Flood w/ Current Configuration • Overtopped? Breached? • Times Loaded (events) • Levee Section • Height, Crest Width, Slopes • Embankment Materials • Foundation Materials • Population and Assets • Total Population • Total Assets
Geomorphology / Foundation Geology • Present typical foundation / subsurface conditions in longitudinal profile and or cross sections to document section being assessed.
Review/Compare ICW Rating with LST Rating in Table format Highlight Primary Factors and other indicators needing attention / discussion. Use table format similar to that shown on following slides. ADJUST TABLE COLUMN WIDTHS AS NEEDED Review of Assessment Ratings
Assessment Rating SummaryPrimary Factors Embankment & Foundation Seepage – U,M,A Embankment Stability – U,M,A Embankment Erosion – U,M,A Closure System - U,M,A Flood Wall Stability - U,M,A Flood Wall Under Seepage - U,M,A
Population at Risk EXAMPLE
Evacuation Effectiveness • Evacuation Planning: A,M,U • [Comments] • Community Awareness: A,M,U • [Comments] • Flood Warning Effectiveness: A,M,U • [Comments] • Computed Evacuation Effectiveness Factor • Breach prior to overtopping = xx% Day ( xx% Night) • Overtopping= xx% Day ( xx% Night) xx% xx% Ineffective Effective
Consequence Data Summary • Weighted Fatality Rate: xxxx% • Threatened Population with Breach prior to Overtopping: Day- xxxxNight- xxxx • Threatened Population with Overtopping: Day- xxxxNight- xxxx • Estimated Loss of Life with Overtopping: xxxx • Estimated Loss of Life Breach Prior to Overtopping: xxxx • Number of Structures Inundated: xxxx • Property Damages (in 1000s): $xxxxxx
Major Contributors to Risk Prior to Capacity Exceedance EXAMPLE
Annualized Risk Whisker EXAMPLE
Performance Index vs. Life Loss Prior to Overtopping EXAMPLE
Recommendation [Recommendation]
Do not include this Slide. This template is a guide for preparing power points presentations. The information requested is important and should be provided in generally the same sequence and same format. But each presentation must be tailored for the specific segment being presented. Some slides can be eliminated and sometimes extra slides will be necessary to best convey the background and backup data needed to make the case for the LSAC Assignment. Pictures are generally a very good method for communicating information on a particular feature or defect being evaluated. Some of the additional summary type slides will eventually be produced directly from the LST but until then you will have to cut and paste the data / graph into the power point. Adjust font size, color, layout, tables, etc. as needed to improve the presentation. Do not overload your slides with too much information; It is better to add a slide. Don’t be surprised to see future revisions to the Power Point. The power point for the SOG will likely be a subset of this power point.