Download
1 / 34
340 likes | 488 Views
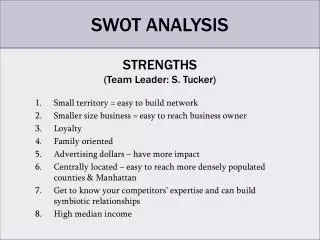
Building Evaluation Capacity in A Complex Environment: The Chesapeake Bay Partnership’s Experience with Evaluation, Adaptive Management and Accountability . Presentation by Michael Mason Evaluation and Accountability Team Leader Office of Water U. S. EPA June 24 th , 2011.

E N D
Building Evaluation Capacity in A Complex Environment: The Chesapeake Bay Partnership’s Experience with Evaluation, Adaptive Management and Accountability Presentation by Michael Mason Evaluation and Accountability Team Leader Office of Water U. S. EPA June 24th, 2011
Topics to be Covered • Chesapeake Bay Partnership 101 • A Little History • The TMDL and its Implementation • Executive Order, Strategy & Implementation • The Turning Point • Evaluation, Adaptive Management, and Accountability • Searching for An Independent Evaluator • Launching An Adaptive Management Approach • What Do We Mean By Accountability in A Partnership?
I.A Chesapeake Bay 101 • Largest U.S. estuary • Six-states and DC, 64,000 square mile watershed • 10,000 miles of shoreline (longer then entire U.S. west coast) • Over 3,600 species of plants, fish and other animals • Average depth: 21 feet • $750 million contribution annually to local economies • Home to 17 million people (and counting) • 77,000 principally family farms • Declared “national treasure” by President Obama 3 Source: www.chesapeakebay.net
Restored Bay Summary: 2008 Bay Health Assessment Priority Areas Water Quality 21% of Goals Achieved Habitats & Lower Food Web 45% of Goals Achieved Not quantified in relation to a goal Fish &Shellfish 48% of Goals Achieved Not quantified in relation to a goal Data and Methods: www.chesapeakebay.net/status_bayhealth.aspx 4
I.A. A Little History • Bay has been a model of collaboration and partnership and coordination with a focus on consensus building • Chesapeake Bay Program established in 1983 • 1987 Chesapeake Bay Agreement • 2000 Chesapeake Bay Agreement (C2K) • Bay Program has always been data rich with strong science and research programs • But Bay was not getting cleaner and goals from previous agreements were not met • Multiple studies and audits in 2005-2007 timeframe (GAO, EPA IG, CBF) • CBPO Report to Congress issued July 2008 (CAP)
I.A. A Little History EPA sued by CBF to develop a Total Maximum Daily Load (“pollution diet”) to hold states accountable for water quality goals for nutrient and sediments. EPA issues Bay Total Maximum Daily Load (TMDL) in December 2010 Load allocation established with goal of 60% of WQ criteria met in Basin by 2025 President issues Executive Order on the Bay in May 2009 E.O. resulted in new federal mandates and enhanced role of federal partners on top of traditionally state partnership/voluntary effort 6
II.B. Chesapeake Bay TMDL • TMDL will establish a ‘pollution budget’ for nitrogen, phosphorus, & sediment • EPA/states set the major river basin loading caps • States set geographic- and source-specific loading caps in their Watershed Implementation Plans • EPA establishes the TMDL
Watershed Implementation Plans identify nutrient and sediment targets that meet water quality standards. Plans include: 1. Evaluation of Program Capacity necessary to fully restore water quality I.B. Overview of TMDL Accountability Process FederalActions Model and Monitor if insufficient Watershed Implementation Plans or 2-year milestones to assess progress Chesapeake Bay TMDL: Set Pollution Reduction Goals for Point and Non-point Sources to Meet Bay Water Quality Standards 2-Year Milestones with program enhancements and nutrient and sediment reduction commitments 2. Identification of Gaps between 3. Schedule and Strategies needed and existing program capacity to enhance programs and reduce nutrients and sediment
I.C. Executive Order, Strategy, and Implementation • May 12, 2009 – President Obama issued Executive Order 13508 for the Protection and Restoration of the Chesapeake Bay • Establishes Federal Leadership Committee (FLC) • Charges federal agencies with developing a Strategy to initiate bold new actions and make dramatic policy changes • Requires FLC to “publish an annual Chesapeake Bay Action Plan describing how Federal funding will be used to protect and restore the Chesapeake Bay.” To be followed by an Annual Progress Report • Establish an Independent Evaluator supported by an adaptive management system to periodically report on progress in meeting goals of Order • May 12, 2010 – Federal agencies releaseStrategy for Protecting and Restoring the Chesapeake Bay Watershed • Includes four goal areas • Twelve outcome measures • September 30, 2010 – Federal agencies release Fiscal Year 2011 Action Plan • Demonstrates federal government leadership and taking responsibility for progress • Total FY2011 federal funding: $490,550,424 • Based on resources directly attributable to Chesapeake strategy
CBP Organizational Structure and Leadership 6-08-11 Independent Evaluator Citizens’ Advisory Committee Chair - Jim Elliot Hunton & Williams LLP Chesapeake Executive Council Chair – Lisa Jackson, EPA Principals’ Staff Committee Chair – Shawn Garvin, EPA Local Government Advisory Committee Chair – Mary Ann Lisanti Harford County ActionTeams Independent Evaluator Chair – Horan, MdDNR EC/FLC Alignment Chair – Bisland, EPA ChesapeakeStat/Adptv. Mgt. Co-Chair – Stewart, MdDNR Co-Chair – Muller, USNA Management Board Acting Chair Jim Edward, EPA Scientific & Technical Advisory Committee Chair – Denise Wardrop PSU Communications Workgroup Chair-Riggs, DeDNREC Vice-Stoltzfus, MDE Goal Implementation Teams Science, Technical Analysis, and Reporting Partnering, Leadership & Management Sustainable Fisheries Protect & Restore Vital Habitats Protect & Restore Water Quality Maintain Healthy Watersheds Foster Chesapeake Stewardship Dennison UMd Bennett USGS Tango USGS Barnes/Gorka CRC Chair ViceChair Cdtr Staff Robertson NOAA O’Connell MdDNR Vogt NOAA Davis CRC • Miranda • USFWS • Horan • MdDNR • Greiner • USFWS • Hession • CRC Merrill EPA Perkinson VaDCR Antos EPA Streusand/Kilbert CRC Bryer NGO(TNC) Hall MdDP Fritz EPA Burnett CRC Maounis NPS Barrett PaDCNR Handen NPS Brzezinski CRC Foreman VaDCR Bisland EPA Allen EPA Wilke CRC Implementation Workgroups Implementation Workgroups Implementation Workgroups Implementation Workgroups Implementation Workgroups Implementation Workgroups
II. The Turning Point or Nature of the Current (Political) Environment Bay Partnership is at a key turning point. Bay Partnership is going through a period of transition from collaborative partnership to a regulatory, top-down approach End of C2K, focus on TMDL, and E.O has resulted in heightened tension and confusion within the partnership There is a disagreement between Feds and states on goals/outcomes for the Bay Tension between federal ecosystem-based approach and state water quality-focused effort Non-water quality Goal Teams appear to be floundering with confusion about their roles, relevance, and responsibilities within partnership Resulted in some gaps & misalignment within the Bay organizational structure 12
II. The Turning Point or the Nature of the Current (Political) Environment • Most Bay partners are supportive of E.O. and the Strategy but are confused about its role and concerned about its impact • Fear it will upset long standing federal-state Bay relationships • Ambiguity of who is in charge: C2K goals or EO goals? What is the controlling document? • Focus on water quality, TMDL, and Watershed Implementation Plans (WIPs) is dominating states’ attention and is driving funding, prioritization, & Bay Program organizational relationships • State partners are afraid of unfunded mandates and too much federal representation • On a bad day, CBP can appear to be a “den of grievances” • Goal Teams vs Management Board • Urban (point sources) vs agriculture (nonpoint) • Headwaters vs Tidal/Bay states • Water quality vs non-water quality partners • States vs Feds • Republican vs Democrats
III.A. Program Evaluation and the Chesapeake Bay • Origin of the Independent Evaluator (IE) • 2005 - U.S. GAO Report recommendation to establish an independent and objective reporting process • 2007 - U.S. GAO Report on need for integrated implementation plan • 2008 - Executive Council established Independent Evaluator Action Team to report to the Management Board • 2009 - Executive Order 13508 calls for independent evaluator to periodically evaluate protection and restoration activities • 2009 – National Academy of Science study begins as evaluation pilot • 2011 – NAS study published
III. A. Program Evaluation and the Chesapeake Bay • Why was an independent evaluator (IE) necessary for the Bay? • Bay Program had lost the trust of Congress and the enviro groups on acknowledging the extent of the water quality problem and the ability to fix it. • Concern from citizens about lack of verification for state and local actions to address water quality • History of IE has been one of foot dragging and fear about loss of control • There has been some confusion about the appropriate location of the IE, its focus, and cost. • Bay Program launched a pilot with National Academy of Science (NAS) in 2009. • NAS conducted 2 year study on nutrients. • What are the lessons learned from the NAS evaluation pilot? • Was this really an evaluation? • Was it independent? • Was it useful? • Is CBP living up its mandate to establish an independent evaluator? • CBP is still debating the role of the IE
III.A. Program Evaluation and the Chesapeake Bay • The Independent Evaluator should focus on WIP implementation and federal and state milestones. • Options for future evaluations would result from milestone reviews and annual watershed model progress runs for TMDL • The Bay Program should develop an internal program evaluation function to conduct assessments on implementation and management issues. • What’s working, not working, & why
III.B. Ches. Bay Program Commitment to Adaptive Management • 2005 – GAO Report recommendation to develop coordinated implementation plan and target resources • 2008 - Chesapeake Action Plan – Report to Congress • 2009 - Executive Order 13508 section 203 (e) • 2010 – Federal Strategy for Protecting and Restoring Bay Watershed • 2010 Proposed Legislation • Chesapeake Bay Governance Document
CBP Adaptive ManagementProgram-LevelSystem Management System Review Evaluation of Ecosystem Response and Organizational Performance Coordinated Implementation Strategy Revision of Strategy Annual Action Plan Action Plan Development Quarterly Review of Progress and Short-Term Adjustments Execute programs and initiatives
III.B. Adaptive Management and the Chesapeake Bay Partners held off on developing an adaptive management system due to the E.O., Strategy development, and TMDL Lack of alignment over goals and reporting and organization put adaptive management on hold until issues could be resolved. CBP partners became more confused about how multiple planning and reporting requirements from EO and TMDL fit together What does the information mean and how should it be used Problem was how to build an AMS within a politically and organizationally fluid environment. Alignment issues are still unresolved but the Bay program is going ahead with AM. Created Decision Framework in 2011. 19
III.B. Chesapeake Bay Decision Framework Articulate program goals. Describe factors influencing goal attainment. Assess current management efforts (and gaps). Develop/Revise management strategy. Develop/Adjust monitoring program. Assess performance. Manage adaptively. 20
III.B. Adaptive Management and the Chesapeake Bay • Current approach to implementing Decision Framework is to start small – focus on a few Goal teams – and gradually work from the bottom up within the organization • Take an incremental step to improving coordination and supporting the ability of the Management Board to: • review performance, • make informed agreements about resource allocation, • identify opportunities for strategic coordination and leveraging of complementary efforts, and • recognize when program redirection is necessary. • This process will also inform other partners and the public about CBP priorities and progress toward achieving those priorities. • ChesapeakeStat tool will be used as platform to facilitate AM • Bay Partnership has the organizational structure to build an effective AM system • It has the data, science, and modeling capability • It needs to start where it is, use what it has, and go forward on an iterative basis. • In other words, take an adaptive approach...
III.B. Adaptive Management and the Chesapeake Bay NAS Conclusions on Bay Partnership’s Approach to Adaptive Management for Improving Water Quality Neither EPA nor Bay jurisdictions exhibit clear understanding of adaptive management and how it might be applied EPA and Bay jurisdictions have not fully analyzed uncertainties inherent in nutrient and sediment reduction efforts and water quality outcomes Targeted monitoring efforts by states and the CBP will be required to support adaptive management The TMDL accountability framework and threatened consequences for failure will dampen Bay’s jurisdictions’ enthusiasm for adaptive management. Without sufficient flexibility of the regulatory and organizational structure, adaptive management may be problematic 22
III.C. Accountability and the Chesapeake Bay • The meaning of accountability is unclear • External vs internal (public vs partner-partner) • Regulatory vs voluntary agreements • Increase vs reduction in funds with grant conditions • All partners could be held accountable through the budgeting process (implementation grants). • States could also be held accountable through WIPs, milestones and TMDL for water quality goals and MOUs for non-water quality goals. • Individual partners should be held accountable for actions they can actually control, rather than long-term environmental outcomes. • There needs to be transparency and verification of data. • Partners need to properly manage the public’s expectations, or will lose the public’s trust.
QUESTIONS AND COMMENTS http://executiveorder.chesapeakebay.net/
II.C. Nutrient Loads by State Nitrogen* Phosphorus *EPA estimates a nitrogen load of 284 million lbs nitrogen in 2008. EPA assumes a reduction of 7 million lbs due to the Clean Air Act. This leaves 77 millions lbs to be addressed through the TMDL process. 26
CBP GIT Implementation Workgroup Structure 06-08-11 Goal Implementation Teams Sustainable Fisheries Protect & Restore Vital Habitats Protect & Restore Water Quality Maintain Healthy Watersheds Enhance Partnering, Leadership & Management Foster Chesapeake Stewardship Fish Passage Workgroup Watershed Health Workgroup Chesapeake Conservation Corps Action Team IT Infrastructure Workgroup Agriculture Workgroup Ches. Bay Stock Assessment Committee Budget and Assistance Coordination Workgroup Forestry Workgroup Stream Habitat Workgroup Land Use Planning Workgroup Education Workgroup Fisheries Ecosystem Workgroup Reevaluation Technical Workgroup Submerged Aquatic Vegetation Workgroup Land ConservationWorkgroup Master Watershed Steward Action Team Sediment Workgroup Single Species Teams Wetlands Evaluation Workgroup Public Access Planning Action Team Urban Stormwater Workgroup Quantitative Ecosystem Teams Wastewater Treatment Workgroup GIS Land Conservation Priority System Team Watershed Technical Workgroup
Major basin jurisdiction loading targets Local Program Capacity/Gap Evaluation TMDL and WIP Development Schedule: 2009-2017 Final WIPs November-December 2010 Oct 2009 Final TMDL Established Bay TMDL Public Meetings December 2010 November-December 2009 Phase II Watershed Implementation Plans: Starting 2011 Provide Local Planning Targets for smaller Watersheds, Counties, Sources Draft Phase I Watershed Implementation Plans: November 2009 – Sept.1 2010 2-year milestones, reporting, modeling, monitoring July 1 and August 13 Allocations Starting 2011 Public Review And Comment Draft TMDL Sept. 24, 2010 (45 days) 2017 60% of Practices in Place - Phase III WIPs to meet 2025 Goal 28
29 29
Example: Projected Nitrogen Delivery from Major Basin in Each Jurisdiction by Source Sector Propose new legislative authorities Implement regulatory controls Examples of Some Planned Controls Propose increased budget to legislature Increased program budget Increased controls Rulemaking 35 26 Load Reduction Schedule 20 Interim Targets Final Targets Milestones for Assessing Progress Stage 1 Implementation Stage 2 Implementation • Also divide jurisdiction load by 303(d) segment drainage area and, by November 2011, local area • Attain jurisdiction-wide load reductions by the interim target, or justify why can still meet final target • Jurisdiction would determine desired 2-year schedule to meet interim and final target loads • EPA first evaluates milestones based on consistency with jurisdiction target load. EPA accepts shifts among source sectors, basins, segment drainages, and local areas if jurisdiction target load is met and local and Bay water quality goals are achieved
II.C. Development of TMDL Tracking System - BayTAS Version 1.0 31 31 • Required by Executive Order Strategy & EPA-CBF Settlement Agreement • Begin to use the system by Jan 2011 • Track TMDLs for 92 Segments in Bay Watershed • Track WLAs for NPDES Point Sources; Track LAs for Non-Point Sources/Sectors; Track Practices reported in WIPS • Are States on target to achieve the Bay TMDL? • Are WLAs being achieved? Are LA’s being achieved? • What is the status of BMP practice implementation and programmatic activities? • What is status of 2-year milestones? • Verification tracking • Future capacity to track generation of offsets and support trading • Make allocations, progress and verification public
The Nature of the Current (Political) Environment Bay Program needs to address 3 areas of alignment: Goals and outcomes Planning and reporting process (e.g., milestones) Renew Bay organizational roles and responsibilities including options for EC-FLC alignment Increase communication between those in states developing the WIPs and people working to meet the E.O. requirements. Reach consensus on outcomes & align them with what states and locals are doing Open up better lines of communication and build stronger relationships between federal agencies and states in key areas, such as land conservation, forest stewardship and public access. Align outcomes and Program organizational structure. Determine one body in charge of making decisions for the partnership and work toward establishing one guiding document. Develop a robust adaptive management system that holds people accountable. 32
Chesapeake Bay Program Annual Program-Level Adaptive Management System Management Board Meeting Schedule 2010 • Interim Management Board Meetings • Objectives • Detailed technical discussions • Resolution of specific issues Final 203 Strategy Issued/EC Meeting Interim Final 203 Strategy Issued 205 Annual Action Plan 2011 July August Sep. Oct. Nov. Dec. Jan. Feb. March May April June March Strategy and Action Plan Review Quarterly Progress Review Quarterly Progress Review Management System Review Management System Review • Objectives • Strategy and Ops Review • Short term adaptation • Information • GIT Progress Reports • External events • Objectives • Strategy and Ops Review • Short term adaptation • Information • GIT Progress Reports • External events • Objectives • Overall system and performance review • Broad strategic shifts • Rebalance resources • Information • Bay Barometer • External Evals. • Dashboards • Budgets • Objectives • Finalize GIT Strategy and Action Plans • Information • Proposed GIT strategy and action plans • Decision tool outputs • Objectives • Health and restoration progress • Management system implementation plans • Interim 203 strategy • Action Plan development • Information • Bay Barometer • Organizational status • Available measures