Download
1 / 7
70 likes | 180 Views
G RAPHING R ATIONAL F UNCTIONS. C ONCEPT. S UMMARY. p ( x ) q ( x ). a m x m + a m – 1 x m – 1 + … + a 1 x + a 0. f ( x ) = =. b n x n + b n – 1 x n – 1 + … + b 1 x + b 0. GRAPHS OF RATIONAL FUNCTIONS.

E N D
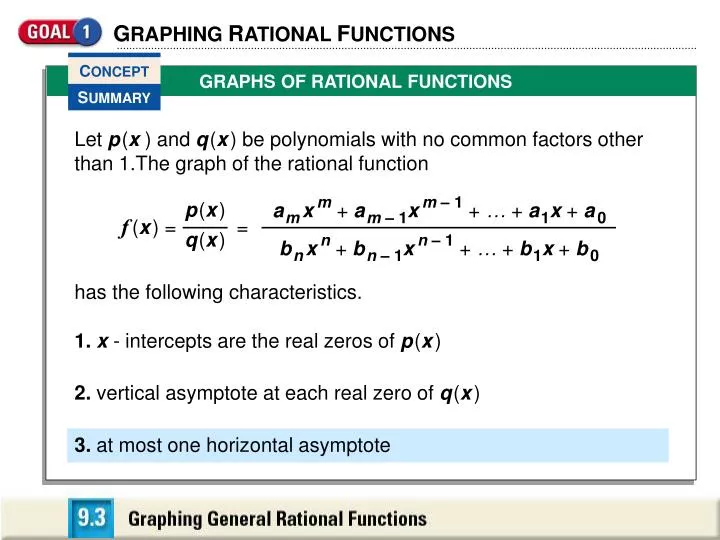
GRAPHING RATIONAL FUNCTIONS CONCEPT SUMMARY p(x) q(x) amxm+am – 1xm – 1+ … +a1x+a0 f(x) = = bnxn+bn –1xn – 1+ … +b1x+b0 GRAPHS OF RATIONAL FUNCTIONS Let p(x) and q(x) be polynomials with no common factors other than 1.The graph of the rational function has the following characteristics. 1.x- intercepts are the real zeros of p(x) 2. vertical asymptote at each real zero ofq(x) 3. at most one horizontal asymptote
GRAPHING RATIONAL FUNCTIONS CONCEPT SUMMARY p(x) q(x) amxm+am –1xm – 1+ … +a1x+a0 f(x) = = 3. at most one horizontal asymptote at each zero ofq(x) bnxn+bn – 1xn – 1+ … +b1x+b0 am bn am bn • If m = n, the line y = is a horizontal asymptote. • If m > n, the graph has no horizontal asymptote. Its end behavior is the same as the graph of y = xm –n . GRAPHS OF RATIONAL FUNCTIONS • If m < n, the line y = 0 is a horizontal asymptote.
4 x2+ 1 Graphing a Rational Function (m < n) State domain and range. Graphy = . SOLUTION The numerator has no zeros, so there is no x-intercept. The denominator has no real zeros, so there is no vertical asymptote. The degree of the numerator (0) is less than the degree of the denominator (2), so the line y = 0 (the x-axis) is a horizontal asymptote. The bell-shaped graph passes through (–3, 0.4),(– 1, 2),(0, 4),(1,2), and (3, 0.4). The domain is all real numbers; the range is 0 < y 4.
3x2 x2– 4 Graphing a Rational Function (m = n) Graphy = . The degree of the numerator (2) is equal to the degree of the denominator (2), so the horizontal asymptote is y = = 3. am bn SOLUTION The numerator has 0 as its only zero,so the graph has one x-intercept at (0, 0). The denominator can be factored as(x + 2)(x– 2), so the denominator haszeros at 2 and –2. This implies vertical asymptotes at x = –2 and x = 2.
3x2 x2– 4 Graphing a Rational Function (m = n) Graphy = . x y x y –4 –3 –1 0 1 3 4 4 5.4 –1 0 –1 5.4 4 To the left of x = –2 Between x = –2 and x = 2 To the right of x = 2 To draw the graph, plot points between and beyond vertical asymptotes.
Graphing a Rational Function (m > n) x2–2x – 3 x+ 4 Graph y = . SOLUTION The numerator can be factored as (x– 3) and (x + 1); the x-intercepts are 3 and –1. The only zero of the denominator is –4, sothe only vertical asymptote is x =–4. The degree of the numerator (2) is greater than the degree of the denominator (1), so there is no horizontal asymptote and the end behavior of the graph of fis the same as the end behavior of the graph of y = x2 –1 = x.
Graphing a Rational Function (m > n) x2–2x – 3 x+ 4 Graph y = . y x y x y –12 –9 –6 –2 0 2 4 6 –20.6 –19.2 –22.5 2.5 –0.75 –0.5 0.63 2.1 To the left of x = –4 To the right of x = –4 To draw the graph, plot points to the left and right of the vertical asymptote.