Download
1 / 8
80 likes | 196 Views
Delegación Iztacalco. Coordinación de Seguridad Pública. Índice Delictivo Delegacional. Comparativos. Periodo: Enero a Junio de 2011. D e l e g a c i ó n I z t a c a l c o. Periodo: Enero – Junio 2011. Comparativo 2011 con 2010. - 4.00 %. - 159 Delitos. Índice Delictivo.

E N D
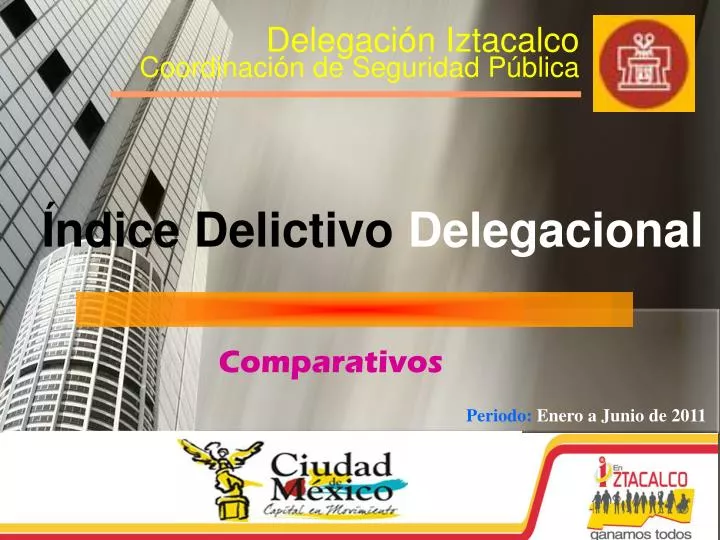
Delegación Iztacalco Coordinación de Seguridad Pública Índice Delictivo Delegacional Comparativos Periodo: Enero a Junio de 2011
D e l e g a c i ó n I z t a c a l c o Periodo: Enero – Junio 2011 Comparativo 2011 con 2010 - 4.00 % - 159 Delitos Índice Delictivo
D e l e g a c i ó n I z t a c a l c o Indice Delictivo por Sector Periodo: Enero – Junio 2011 (Cifras Propias de los Sectores) Sector 3 Pantitlan Sector 2 Tlacotal - 10.03 % Sector 1 Iztaccihuatl - 1.76 % + 1.36 % Comparativo 2011 con 2010
D e l e g a c i ó n I z t a c a l c o Comparativo del Primer Semestre de 2011 con Años Anteriores Grafica General ( Incluye los Tres Sectores ) 4,137 D e l i t o s 3,939 D e l i t o s 3,978 D e l i t o s -159 - 4.00%
D e l e g a c i ó n I z t a c a l c o Comparativo del Primer Semestre de 2011 con Años Anteriores Grafica General ( Sector 1 Iztaccihuatl ) 1,147 D e l i t o s 1,104 D e l i t o s 1,119 D e l i t o s +15 + 1.36%
D e l e g a c i ó n I z t a c a l c o Comparativo del Primer Semestre de 2011 con Años Anteriores Grafica General ( Sector 2 Tlacotal ) 1,387 D e l i t o s 1,363 D e l i t o s 1,236 D e l i t o s -24 - 1.76%
D e l e g a c i ó n I z t a c a l c o Comparativo del Primer Semestre de 2011 con Años Anteriores Grafica General ( Sector 3 Pantitlan ) 1,646 D e l i t o s 1,556 D e l i t o s 1,496 D e l i t o s -150 - 10.03%
D e l e g a c i ó n I z t a c a l c o Disminución de Algunos Delitos de Alto Impacto. La Siguiente Tabla, nos muestra los Delitos de Alto Impacto con tendencia a la Baja, comparando el año 2011 con 2010 en el periodo de Enero a JUNIO, DATOS GLOBALES, INCLUYE A LOS 3 SECTORES