Download
1 / 7
70 likes | 73 Views
The ever increasing size of students at Colleges and Universities in Ethiopia also reflect that they are entering<br>colleges with more diverse cultural characteristics and needs than ever before. The purpose of this study was to see<br>the determinants and level of satisfaction of Dire Dawa University and Jigjiga University students attending their regular<br>higher education programme of three years in the common Colleges of Social Sciences and Humanities, Business<br>and Economics and Natural and Computational Sciences. Three departments were randomly selected by using<br>Simple random sampling method from each college namely Geography, Political Science, Psychology, Economics,<br>Management, Accounting, Management, Statistics, Biology and Chemistry respectively. A total of 346 participants<br>and 6 FGDsu2019 members (n=36) were used from regular students of undergraduate programme (2016/2017) in Dire<br>Dawa (n=189) and Jigjiga University (n=157). FGDs and questionnaires were both developed by adapted from the<br>standardized studentsu2019 satisfaction measures (SSI) used earlier and similar studies by the researcher based on the<br>purpose of the pilot tested with 22 participants for the questionnaire and 8 participants for the FGDs. Computation of<br>mean, standard deviation, percentages, frequencies, one way ANOVA and T-test were used to analyze the collected<br>data through SPSS version 20.

E N D
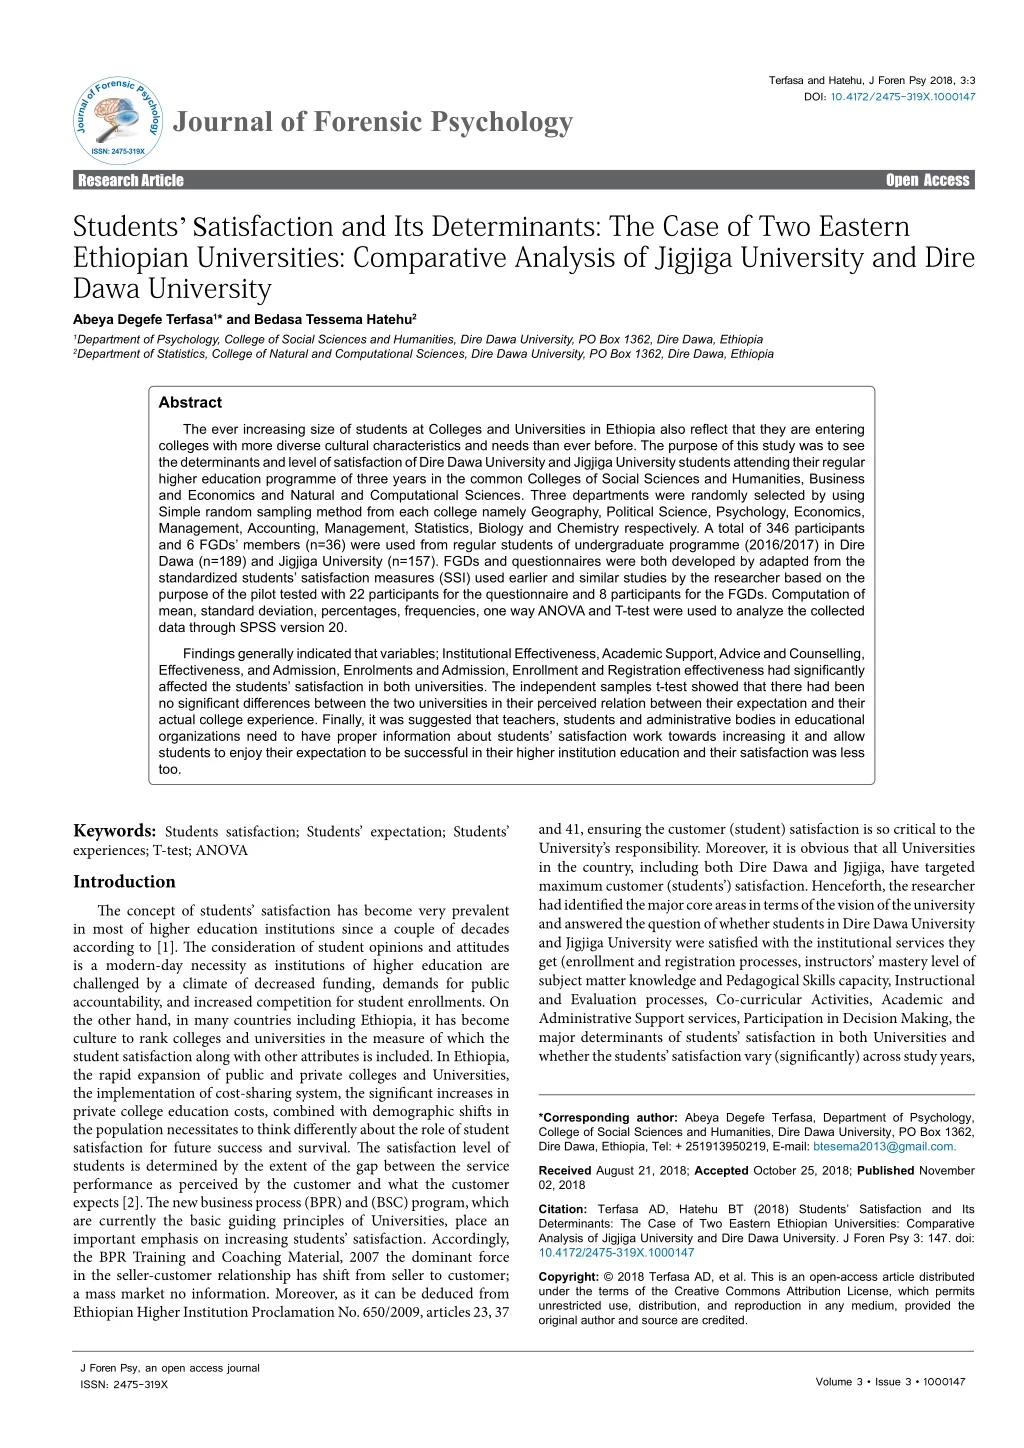
Terfasa and Hatehu, J Foren Psy 2018, 3:3 DOI: 10.4172/2475-319X.1000147 JournalofForensicPsychology Journal of Forensic Psychology ISSN: 2475-319X Research Article Research Article Open Access Open Access Students’ Satisfaction and Its Determinants: The Case of Two Eastern Ethiopian Universities: Comparative Analysis of Jigjiga University and Dire Dawa University Abeya Degefe Terfasa1* and Bedasa Tessema Hatehu2 1Department of Psychology, College of Social Sciences and Humanities, Dire Dawa University, PO Box 1362, Dire Dawa, Ethiopia 2Department of Statistics, College of Natural and Computational Sciences, Dire Dawa University, PO Box 1362, Dire Dawa, Ethiopia Abstract The ever increasing size of students at Colleges and Universities in Ethiopia also reflect that they are entering colleges with more diverse cultural characteristics and needs than ever before. The purpose of this study was to see the determinants and level of satisfaction of Dire Dawa University and Jigjiga University students attending their regular higher education programme of three years in the common Colleges of Social Sciences and Humanities, Business and Economics and Natural and Computational Sciences. Three departments were randomly selected by using Simple random sampling method from each college namely Geography, Political Science, Psychology, Economics, Management, Accounting, Management, Statistics, Biology and Chemistry respectively. A total of 346 participants and 6 FGDs’ members (n=36) were used from regular students of undergraduate programme (2016/2017) in Dire Dawa (n=189) and Jigjiga University (n=157). FGDs and questionnaires were both developed by adapted from the standardized students’ satisfaction measures (SSI) used earlier and similar studies by the researcher based on the purpose of the pilot tested with 22 participants for the questionnaire and 8 participants for the FGDs. Computation of mean, standard deviation, percentages, frequencies, one way ANOVA and T-test were used to analyze the collected data through SPSS version 20. Findings generally indicated that variables; Institutional Effectiveness, Academic Support, Advice and Counselling, Effectiveness, and Admission, Enrolments and Admission, Enrollment and Registration effectiveness had significantly affected the students’ satisfaction in both universities. The independent samples t-test showed that there had been no significant differences between the two universities in their perceived relation between their expectation and their actual college experience. Finally, it was suggested that teachers, students and administrative bodies in educational organizations need to have proper information about students’ satisfaction work towards increasing it and allow students to enjoy their expectation to be successful in their higher institution education and their satisfaction was less too. Keywords: Students satisfaction; Students’ expectation; Students’ experiences; T-test; ANOVA Introduction The concept of students’ satisfaction has become very prevalent in most of higher education institutions since a couple of decades according to [1]. The consideration of student opinions and attitudes is a modern-day necessity as institutions of higher education are challenged by a climate of decreased funding, demands for public accountability, and increased competition for student enrollments. On the other hand, in many countries including Ethiopia, it has become culture to rank colleges and universities in the measure of which the student satisfaction along with other attributes is included. In Ethiopia, the rapid expansion of public and private colleges and Universities, the implementation of cost-sharing system, the significant increases in private college education costs, combined with demographic shifts in the population necessitates to think differently about the role of student satisfaction for future success and survival. The satisfaction level of students is determined by the extent of the gap between the service performance as perceived by the customer and what the customer expects [2]. The new business process (BPR) and (BSC) program, which are currently the basic guiding principles of Universities, place an important emphasis on increasing students’ satisfaction. Accordingly, the BPR Training and Coaching Material, 2007 the dominant force in the seller-customer relationship has shift from seller to customer; a mass market no information. Moreover, as it can be deduced from Ethiopian Higher Institution Proclamation No. 650/2009, articles 23, 37 and 41, ensuring the customer (student) satisfaction is so critical to the University’s responsibility. Moreover, it is obvious that all Universities in the country, including both Dire Dawa and Jigjiga, have targeted maximum customer (students’) satisfaction. Henceforth, the researcher had identified the major core areas in terms of the vision of the university and answered the question of whether students in Dire Dawa University and Jigjiga University were satisfied with the institutional services they get (enrollment and registration processes, instructors’ mastery level of subject matter knowledge and Pedagogical Skills capacity, Instructional and Evaluation processes, Co-curricular Activities, Academic and Administrative Support services, Participation in Decision Making, the major determinants of students’ satisfaction in both Universities and whether the students’ satisfaction vary (significantly) across study years, *Corresponding author: Abeya Degefe Terfasa, Department of Psychology, College of Social Sciences and Humanities, Dire Dawa University, PO Box 1362, Dire Dawa, Ethiopia, Tel: + 251913950219, E-mail: btesema2013@gmail.com. ReceivedAugust 21, 2018; AcceptedOctober 25, 2018; Published November 02, 2018 Citation: Terfasa AD, Hatehu BT (2018) Students’ Satisfaction and Its Determinants: The Case of Two Eastern Ethiopian Universities: Comparative Analysis of Jigjiga University and Dire Dawa University. J Foren Psy 3: 147. doi: 10.4172/2475-319X.1000147 Copyright: © 2018 Terfasa AD, et al. This is an open-access article distributed under the terms of the Creative Commons Attribution License, which permits unrestricted use, distribution, and reproduction in any medium, provided the original author and source are credited. J Foren Psy, an open access journal ISSN: 2475-319X Volume 3 • Issue 3 • 1000147
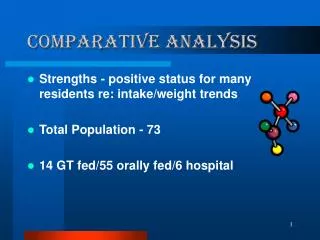
Citation: Terfasa AD, Hatehu BT (2018) Students’ Satisfaction and Its Determinants: The Case of Two Eastern Ethiopian Universities: Comparative Analysis of Jigjiga University and Dire Dawa University. J Foren Psy 3: 147. doi: 10.4172/2475-319X.1000147 Page 2 of 7 colleges, and departments in each universities. The general objective of the study was to investigate the level of students’ satisfaction and its correlates in Dire Dawa University and Jigjiga University. Students Satisfaction and Its Measurement In the sense of education, student satisfaction refers to the favorability of a student’s subjective evaluations of the various outcomes and experiences associated with education [3]. Like any other business, a university is becoming a centre of a highly competitive environment. According to [4], scientific and empirical research studies on student satisfaction are often based on specific models and instruments developed by the authors. However, most higher education institutions prefer to use their own domestic instruments to assess student satisfaction in general or student satisfaction with particular aspects of the college experience of their interest. Nevertheless, it is more advantageous to customize the instruments to the mission and goals of the institution. From this perspective, satisfaction with college occurs when an expectation is met or exceeded by an institution. The SSI was developed to assess the following 12 dimensions: Academic advising Effectiveness, Campus Climate, Campus Support Services, Concern for the individual, Instructional Effectiveness, Admissions and Financial aid effectiveness, Registration effectiveness, Responsiveness to diverse populations, Safety and Security, Service Excellence, Student Centeredness, and campus life. A unique feature of the SOS instrument is that it assesses the importance assigned by students to each aspect of the academic experience and evaluates the students’ satisfaction. ServQual is one of the models of students’ satisfaction tested by Browne et al. They analyzed the ServQual model using regression analysis in a study that included ServQual dimensions as well as curricular dimensions. Service consumer and product consumer Educational services and business organization services are different in that the former is characterized the services that are elusive, varied, inseparable from the person delivering it, unpredictable, fragile, and the customer (student) participates in the process whereas the later is characterized by concrete, reproducible items, etc. [5-10]. Moreover, the below diagram can further illustrate the comparison of the perception and satisfaction of quality of service consumers and product consumers. • Students consume educational services whereas others consume industry goods/items or products. • Higher Education Institutions are process oriented aimed at transformation of students’ behavior while industries are output oriented aimed at production of quality items. • The process in Higher Education Institutions involve customization of the learning experiences to students needs to increase their satisfaction where the later involve standardization of outputs to increase the satisfaction of the consumers. • The quality in Higher Education Institutions services is perceived in terms of their degree to meet or exceed the expectation of the students (“fitness to purpose”) whereas the quality in outputs of industries is perceived from the extent of the standardization to be perfect and constant quality with low price. Theoretical framework The theoretical framework of this study was based on SSI concept to measure the relative gap between pre-expectation and the perceived performance satisfaction of students from of Dire Dawa University and Jijiga University. From this perspective, satisfaction with college occurs when an expectation is met or exceeded by an institution. Satisfaction = Experience >/= Expectation Satisfaction = Experience ≥ Expectation The context of the research area The research was specifically limited to the three common colleges of both Universities named as College of Business and Economics, College of Natural and Computational Science, College of Social Sciences and Humanities. These Universities and colleges were selected and needed to be compared due to the following reasons; • Satisfaction is relative and needs to be comparatively evaluated in order to convey more meaning full message. • The nature of the study is comparative in which the two Universities are likely comparable as they both are young institutions established together in nearly the same year, found in the same cluster in which they share similar curriculum, found in nearly the same culture, society and religion in which they are the same category as they are Similar in various aspects . • It’s research extra-benefit (worthy studying) to compare a result of a research for two in the same category. • Dire Dawa University is speculated to have satisfied students more than others relatively- not statistically tested and supported with evidence. • Helps to analyze difference (if any) in students’ satisfaction other factors remaining constant. • Used as spring board to create collaboration in research environment. • Moreover, the comparison can be used as the way to lead to a mutual support system of fund on the research. Data Analysis Population, sample and sampling techniques The target population of this study was regular Students of the colleges of Business and Economics, Natural and Computational Science and Social Science and Humanities. The researcher selected these colleges because they are common to both Universities and study years. The common departments included Accounting, Management, and Economics from CBE, Biology, Statistics, Chemistry from CNCS and Geography and Environmental Studies (GeES), Political Science and International Relations (PSIR) and Psychology. The total population of the study was 3694 (Dire Dawa University total 2022; M=1265, F=757; Jigjiga University total 1672; M=1048, F=624) [11-15].The following table shows the figure of the total participants of the study (Figure 1). Sample size determination Determining the appropriate sample size required is basically dependent on available resources and level of precision required. Our sample size (number of students) was calculated using the Cochran’s (1977) sample size calculation formula: α 2 ( z ) 2 η = − p(1 p ) 0 2 d J Foren Psy, an open access journal ISSN: 2475-319X Volume 3 • Issue 3 • 1000147
Citation: Terfasa AD, Hatehu BT (2018) Students’ Satisfaction and Its Determinants: The Case of Two Eastern Ethiopian Universities: Comparative Analysis of Jigjiga University and Dire Dawa University. J Foren Psy 3: 147. doi: 10.4172/2475-319X.1000147 Page 3 of 7 relevance to job market. From the above Table 3, the grand mean score of DDU is greater than the grand mean score of JJU students. These show DDU students have higher expectation than JJU students in Instructional Effectiveness and the grand mean score of JJU is greater than the grand mean score of DDU students, this indicates JJU students have higher expectation than DDU students in Curriculum Relevance to Job Market. Moreover, we can also recognize that students of DDU departments of Biology, Statistics, Chemistry and PSIR have higher expectation for Instructional Effectiveness than their respective departments in JJU. Furthermore depicted that that students of JJU departments of Management, Biology, PSIR, Geography, and Psychology have higher expectation for Curriculum Relevance to Job Market than their respective departments in DDU. According to both Tables 4 and 5, both the t-test and ANOVA test results showed that there is significant difference between both universities on the satisfaction level except for three attributes; Academic Support, Advice and Counseling, Instructional effectiveness and Admission, Enrollment and Registration [21-24]. The gap between respondents’ expectation and their experience This section deals with whether the university experience has met the expectation of the students. From the Table 6, the mean scores of DDU university respondents was relatively greater than mean score of JJG university respondents which shows that both universities had less experience than their expectation. The Table 7 of Independent Samples t-test shows that there had been no significant differences between the two universities in their perceived relation between their expectation and their actual college experience. The extent to which the university experience has met the satisfaction of the respondents This section deals with the analysis of the degree to which the experience the students had affected their satisfaction. As can be seen from Table 8, the majority of the students reported that they were not satisfied with their experience in the University (47.4%). Comparatively, DDU students were bit better satisfied than JJU students (22%>14%). Table 9 shows that there was significant difference (F (1, 345); P<0.05=6.893) between both universities in overall satisfaction with the experience they had in the university. This means respondents were different in their satisfaction with college experiences so far. Table 10 shows that there was no significant difference (F (1, 345); P<0.05=0.769) among departments in overall satisfaction with the experience they had in the university. This means respondents were not different in their satisfaction with their college experiences, department wise. Relationship between experience and satisfaction Figure 1: Analogy of satisfaction of service consumer and product consumer. Where:- n=The required total sample size of students N=The total number of number of students in both university (3694) Z=The standard normal cumulative distribution that corresponds to the 5 percent level of confidence (Z=1.96) =The success of probability (proportion of respondents who are satisfied with their universities) =The level of precision (sampling error) For this study, p=0.05, was used to get maximum number of samples (representatives) for our studies. The sampling error ( ) is the difference between the parameter to be estimated and the corresponding statistic computed from the sample. In this study a value of sampling error is 0.055 at 5 percent significance level was used. Therefore, the possible sample size estimated for this study was: × − × = 2 ( z ) (1 0.05) 0.05 0.055 (1.96) (0.055) 2 η = 0.05 0.05 × ≈ 0.05/2 315 0 2 2 To determine the sample size for general population use the total number of students in both universities. Adding 10% contingency for expected non-response rate, the final sample size estimated is: n= 315 + 0.1(315) ~ 346 Therefore, the final sample size selected for this study was 346 students from both Universities. The sample was proportional allocated to both universities [16-20]. From the Table 1, one can understand that more than 80 % of students of the respondents don’t know the vision and mission of their Universities. However, relatively more DDU students (38%) than JJU students (22%) know their University’s vision and mission. From the above Table 2, one can understand that there is no significant difference between the two Universities in their expectation level of attributes of satisfaction except for perceived importance of instructional effectiveness and perceived importance of program Stratum sample in university Population (Nh) Sample (Nh) Dire Dawa University 2022 189 Jigjiga University 1672 157 Total 3694 346 Table 1: Sample size. J Foren Psy, an open access journal ISSN: 2475-319X Volume 3 • Issue 3 • 1000147
Citation: Terfasa AD, Hatehu BT (2018) Students’ Satisfaction and Its Determinants: The Case of Two Eastern Ethiopian Universities: Comparative Analysis of Jigjiga University and Dire Dawa University. J Foren Psy 3: 147. doi: 10.4172/2475-319X.1000147 Page 4 of 7 DDU JJU I know University's Vision and Mission Yes 18 10 12 9 4 7 5 4 3 72 No 26 20 10 21 13 8 7 2 10 117 Yes 6 5 5 5 3 6 2 1 1 34 No 21 15 11 20 15 8 16 9 8 123 First Year Second Year Third Year First Year Second Year Third Year First Year Second Year Third Year Total Percentage CBE CNCS CSSH 38 62 22 78 Table 2: Respondents’ knowledge of their University’s vision and mission. T-test for Equality of Means Sig. (2-tailed) 0.012 Attributes of Expectation Std. Error Difference 0.04154 t df Mean Difference Difference Instructional Effectiveness 2.534 344 0.10525 Significant Academic support, advice and counseling effectiveness 1.828 344 0.068 0.08408 0.046 Not significant Assessment and evaluation effectiveness 1.754 344 0.08 0.04998 0.02849 Not significant Facility, infrastructure and resource Quality Curriculum/ -0.333 -2.34 344 344 0.739 0.02 -0.01351 -0.07613 0.04057 0.03254 Significant Significant Programme relevance to job market Leadership and management effectiveness -1.635 344 0.103 -0.06231 0.03812 Not significant Support service quality 0.542 344 0.588 0.01608 0.02965 Not significant Admission, enrollment and registration effectiveness 1.82 344 0.07 0.04577 0.02515 Not significant The Availability of various co-curricular activities 1.148 344 0.252 0.05018 0.04372 Not Significant Table 3: T-test for the expectation level for the attributes of satisfaction by University. T-test for Equality of Means Attributes of Expectation Sig. Std. Error Difference T Df Mean Difference Difference (2-tailed) Instructional effectiveness 3.169 343 0.002 0.30556 0.09643 Significant Academic support, advice and counseling effectiveness 2.374 344 0.018 0.22667 0.09548 Significant Assessment and evaluation effectiveness 0.738 344 0.461 0.07438 0.10075 Not Significant Facility, infrastructure and resource quality 0.976 344 0.33 0.07717 0.07907 Not Significant Curriculum/ programme relevance to job market -0.025 344 0.98 -0.00233 0.09169 Not Significant Leadership and management effectiveness 0.462 344 0.644 0.04442 0.09612 Not Significant Support service quality 1.779 344 0.076 0.16641 0.09353 Not Significant Admission, enrollment and registration effectiveness 2.942 344 0.003 0.2694 0.09158 Significant The Availability of various co-curricular activities -0.526 344 0.599 -0.04287 0.08155 Not Significant Table 4: T-test for the satisfaction level of students by University. The following section deals with the relationship between Students’ College Experience in terms of what they expected and how they were satisfied. Accordingly the following correlation table reveals that there is positive relationship between the two variables. According to Table 11, there is positive relationship between the extent to which the college experience met the expectation of the respondents and their satisfaction level. Relationship between expectation and satisfaction The following deals with the relationship between Students’ Expectations and their actual satisfaction. Accordingly, the correlation table revealed that there is positive relationship between the two variables. Table 12 explained that there was no significant difference between students’ expectation level and their satisfaction level by department in both Universities. Hence, the students were significantly less satisfied than they expected. Table 13 showed that there was significant difference between J Foren Psy, an open access journal ISSN: 2475-319X Volume 3 • Issue 3 • 1000147
Citation: Terfasa AD, Hatehu BT (2018) Students’ Satisfaction and Its Determinants: The Case of Two Eastern Ethiopian Universities: Comparative Analysis of Jigjiga University and Dire Dawa University. J Foren Psy 3: 147. doi: 10.4172/2475-319X.1000147 Page 5 of 7 Mean Square 7.979 0.795 Sum of Squares df F Sig. Difference Between Groups Within Groups Total Between Groups Within Groups 7.979 272.583 280.562 4.406 268.958 1 10.04 0.002 Perceived Satisfaction on Academic Support and Advice 343 344 1 344 Significant 4.406 5.636 0.018 0.782 Perceived Satisfaction on Instructional Effectiveness Significant 345 Total 273.364 0.474 1 0.474 Between Groups Perceived satisfaction on Assessment and Evaluation Effectiveness 0.545 0.461 Not Significant Within Groups 299.482 299.957 0.511 184.449 184.960 0.000 248.002 248.003 0.169 272.571 272.740 2.375 258.064 260.439 6.224 247.417 253.642 0.158 196.201 196.358 344 345 1 344 345 1 344 345 1 344 345 1 344 345 1 344 345 1 344 345 0.871 Total Between Groups Within Groups Total Between Groups Within Groups Total Between Groups Within Groups Total Between Groups Within Groups Total Between Groups Within Groups Total Between Groups Within Groups Total 0.511 0.536 0.953 0.330 Perceived Satisfaction on Facilities, Infrastructure and Resources Quality Not Significant 0.000 0.721 0.001 0.980 Perceived Satisfaction on Curriculum Relevance to Job Not Significant 0.169 0.792 0.214 0.644 Perceived Satisfaction on Leadership and Management Effectiveness Not Significant 2.375 0.750 3.166 0.076 Perceived Satisfaction on Support Service Quality Not Significant 6.224 0.719 Perceived Satisfaction on Admission, Enrollment and Registration Significant 0.158 0.570 0.570 0.599 Perceived Satisfaction on Availability of Various Co-Curricular Activities Not Significant Table 5: One way ANOVA result for satisfaction level by University. Mean Score on How far the University Experience met the expectation of the Students Mean N Std. Deviation University DDU JJU DDU JJU DDU JJU Minimum Maximum CBE 1.5104 1.5238 96 63 0.71074 0.73741 1 3 CNCS 1.5484 1.4386 62 57 0.69371 0.68184 1 3 CSSH 1.7419 1.5946 31 37 0.72882 0.7979 1 3 Total 1.5608 1.5096 189 157 0.70917 0.73045 1 3 Table 6: The extent to which the university experience met respondents’ expectation. t-test for Equality of Means 95% Confidence Interval Std. Error Difference t df Sig. (2-tailed) Mean Difference Lower Upper Did the University Experience met the expectation of the Students 0.661 344 0.509 0.05129 .07763 -0.10140 0.20398 Table 7: Independent t-test for expectation vs experience by University. Expectation of students and their satisfaction level within University. Conclusion The main aim of this study was to investigate the level of students’ satisfaction and its correlates in Eastern part of Ethiopian University (Dire Dawa and Jigjiga University) using Primary collected data. Both Descriptive and Inferential statistical analyses were employed to examine factors affecting the level of students’ satisfaction. This study was based on a dataset of students’ satisfaction and their determinants in the case of Eastern Ethiopian universities (Dire Dawa and Jigjiga) J Foren Psy, an open access journal ISSN: 2475-319X Volume 3 • Issue 3 • 1000147
Citation: Terfasa AD, Hatehu BT (2018) Students’ Satisfaction and Its Determinants: The Case of Two Eastern Ethiopian Universities: Comparative Analysis of Jigjiga University and Dire Dawa University. J Foren Psy 3: 147. doi: 10.4172/2475-319X.1000147 Page 6 of 7 To what extent did your experience met your Expectation? DDU JJU Total Frequency Percent (%) Frequency Percent (%) Frequency Percent (%) Not Satisfied 76 22 88 25.4 164 47.4 Uncertain 37 10.7 21 6.1 58 16.76 Satisfied 76 22 48 13.9 124 35.84 Total 189 54.6 157 45.4 346 100 Table 8: Frequency and percentage of the degree to respondents were satisfied with their experience by University. Sum of Squares df Mean Square F Sig. Between Groups 5.567 1 5.567 6.893 0.009 Within Groups 277.809 344 0.808 Total 283.376 345 Table 9: Summary of ANOVA on overall satisfaction with University experience, University wise Sum of Squares df Mean Square F Sig. Between Groups 5.078 8 0.635 0.769 0.631 Within Groups 278.298 337 0.826 Total 283.376 345 Table 10: Summary of ANOVA overall satisfaction with University experience, Department wise Correlations Experience Meeting Expectation Satisfaction with Experience Pearson Correlation 1 .372** Experience Meeting Expectation Sig. (2-tailed) 0 N 346 346 Pearson Correlation .372** 1 Satisfaction with Experience Sig. (2-tailed) 0 N 346 346 **. Correlation is significant at the 0.01 level (2-tailed). Table 11: The correlation between degree of experience meeting expectation and satisfaction level Correlations Average Expectation Average Satisfaction Pearson Correlation 1 0.2 Average Expectation Sig. (2-tailed) 0.71 N 346 345 Pearson Correlation 0.2 1 Average Satisfaction Sig. (2-tailed) 0.71 N 345 345 Table 12: Correlation between students’ expectation and satisfaction by department. Paired Differences T Df Sig. (2-tailed) Mean Std. Deviation Average Expectation -Average Satisfaction 1.26441 .46424 50.589 344 .000 Table 13: Paired samples T-test for expectation and satisfaction within University. with an aim of investigate the level of students’ satisfaction and its correlates. Out of the total 346 in both university, about (163) 47.11% of the students (respondents) were Female and (183) 52.89% were male. From the study one can understand that more than 80% of students didn’t know the vision and mission of their Universities. However, relatively more DDU students (38%) than JJU students (22%) know their University’s vision and mission when DDU compared with JJU. The students in DDU had significantly higher expectation than JJU students in Instructional Effectiveness and students. Students in JJU had significantly higher expectation than DDU students in Curriculum relevance to job market. The result of the study showed that there is significant difference in the satisfaction attributes (variables) of J Foren Psy, an open access journal ISSN: 2475-319X Volume 3 • Issue 3 • 1000147
Citation: Terfasa AD, Hatehu BT (2018) Students’ Satisfaction and Its Determinants: The Case of Two Eastern Ethiopian Universities: Comparative Analysis of Jigjiga University and Dire Dawa University. J Foren Psy 3: 147. doi: 10.4172/2475-319X.1000147 Page 7 of 7 instructional effectiveness, academic support, advice and counseling effectiveness and admission, enrollment, and registration process effectiveness. This indicates the variables are significantly affect the students’ satisfaction in both universities.The independent samples t-test shows that there had been no significant differences between the two universities in their perceived relation between their expectation and their actual college experience. 11. Elliott KM, Shin D (2002) Student satisfaction: An alternative approach to assessing this important concept. J High Educ 24: 197-209. 12. Joseph M, Yakhou M, Stone G (2005) An educational institution’s quest for service quality: customers’ perspective. Quality Assurance in Education 13: 66-82. 13. Keaveney, Susan M, Clifford E Young (1997) The Student Satisfaction and Retention Model (SSRM), working paper, University of Colorado at Denver, USA. References 14. Kotler P, Fox KFM (1995) Strategic marketing for educational institutions. Eglewood Cliffs, Prentice Hall. NJ, USA. 1. Anderson EW, Fornell C, Rust RT (1997) Customer satisfaction, productivity, and profitability: Differences between goods and services. Market sci 16: 129- 145. 15. Letcher DW, Neves JS (2010) Determinants of undergraduate business student satisfaction, The College of New Jersey, USA. 2. Athiyaman A (1997) Linking student satisfaction and service quality perceptions: The case of university education. Eur J Mark 31: 528-540. 16. Lagrosen S, Seyyed-Hashemi R, Leitner M (2004) Examination of the dimensions of quality in higher education. Quality Assurance in Education 12: 61-69. 3. Babin BJ, Griffin M (1998) The nature of satisfaction: An updated examination and analysis. J Bus Res 41: 127-236. 17. Middaugh MF (2001) Understanding Faculty Productivity: Standards and Benchmarks for Colleges and Universities. Jossey-Bass Publishers, San Francisco, USA. 4. Cranny CJ, Smith PC, Stone EF (1992) The construct of job satisfaction. In Cranny CJ, Smith PC, Stone EF (Ed.), Job Satisfaction. Lexington Books, New York, USA. 18. Oliver RL (1981) Measurement and evaluation of satisfaction processes in retail settings. J Retailing 57: 25-48. 5. Cronin Jr.JJ,Taylor SA (1992) Measuring service quality: A reexamination and extension. J Mark 56: 55-68. 19. Parasuraman A, Valarie Z, Leonard B (1986) SERVQUAL: A multiple-item scale for measuring customer expectations of service quality. Marketing Science Institute, Cambridge, USA. 6. Dominowski RL (2002) The educational psychology series. Teaching undergraduates. Mahwah, Lawrence Erlbaum Associates Publishers, New Jersey, USA. 20. Reisberg, Leo (1999) Colleges struggle to keep would-be dropouts enrolled, The Chronicle of Higher Education. J Retailing A54-A56. 7. Doyle Jr KO (2005) Student Evaluation of Instruction. Lexington Books, New York, USA. 21. Shank MD, WalkerM, Hayes T (1995) Understanding professional service expectations: Do we know what our students expect in a quality education? Journal of Professional Services Marketing 13:71-83. 8. Green JA (1970) Introduction to measurement and evaluation. Dodd Mead, New York, USA. 22. Staples DS, Higgins CA (1998) A study of the impact of factor importance weightings on job satisfaction measures. J Bus Psychol 13: 211-232. 9. Howard GS, Conway CG, Maxwell SE (1985) Construct validity of measures of college teaching effectiveness. J Educ Psychol 77: 187-196. 23. Tinto, Vincent (1993) Leaving college: Rethinking the causes and cures of student attrition, 2nd edn, University of Chicago Press, Chicago, South Ellis Avenue, USA. 10. Hunt KH (1977) Overview and future directions, Conceptualization and measurement of consumer satisfaction and dissatisfaction. Marketing Science Institute. Cambridge, MA, USA. 24. Tinto, Vincent (1975) Dropout from higher education: A theoretical synthesis of recent research, Review of Educational Research 45: 89-125. J Foren Psy, an open access journal ISSN: 2475-319X Volume 3 • Issue 3 • 1000147