Download
1 / 46
460 likes | 577 Views
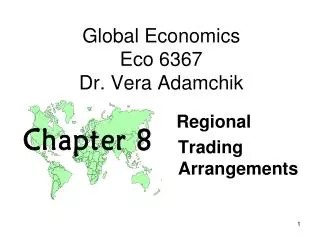
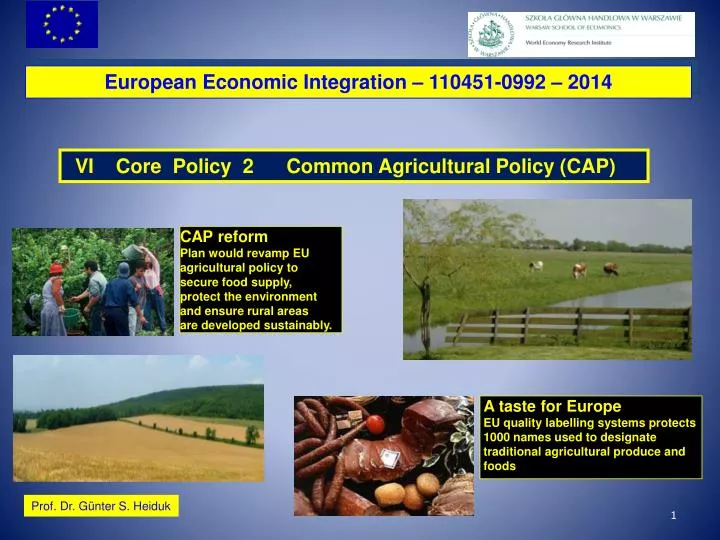
European Economic Integration – 110451-0992 – 2014. VI Core Policy 2 Common Agricultural Policy (CAP). CAP reform Plan would revamp EU agricultural policy to secure food supply, protect the environment and ensure rural areas are developed sustainably. A taste for Europe

E N D
European Economic Integration – 110451-0992 – 2014 VI Core Policy 2Common Agricultural Policy (CAP) CAP reform Plan would revamp EU agricultural policy to secure food supply, protect the environment and ensure rural areas are developed sustainably. A taste for Europe EU quality labelling systems protects 1000 names used to designate traditional agricultural produce and foods Prof. Dr. Günter S. Heiduk
WORLD TOP 10: WHEAT PRODUCTION STATISTICS YEAR 2012 RANK COUNTRY MILLION METRIC TONS 1 China 125.6 2 India 94.9 3 United States 61.8 4 France 40.3 5 Russia 37.7 6 Australia 29.9 7 Canada 27 8 Pakistan 23.5 9 Germany 22.4 10 Turkey 20.1 Europe is one of the largest producer of agricultural products and both a major exporter and the world’s largest importer of food, mainly from developing countries! European Union approx. 133.0 Source: FAO??????
Wheat – Supply and Demand by Top 10 Producer Countries, 2010 (thousand metric tonnes) Source: http://www.spectrumcommodities.com/education/commodity/statistics/wheattable.html
European Integration VI Core Policy 2Common Agricultural Policy (CAP) Utilised agriculture area, % EU-27, 2010 Utilised agriculture area by land use, EU-27, 2010 (% share of utilised agr area)
European Integration VI Core Policy 2Common Agricultural Policy (CAP) EU-27, production of selected agricultural products, 2010
European Integration VI Core Policy 2Common Agricultural Policy (CAP) Index of the real income of factors in agriculture per annual work unit, 2005=100
European Integration VI Core Policy 2Common Agricultural Policy (CAP) Trends in EU agricultural income per work unit, Indicator A, 2005-2012 (% change compared with previous year) Source: EUROSTAT, aact_eaa06
European Integration VI Core Policy 2Common Agricultural Policy (CAP) Share of exports/imports by Member States on extra-EU-27 trade in SITC 0-1, 2010 Exports Imports
European Integration VI Core Policy 2Common Agricultural Policy (CAP) Source: European Commission, The CAP towards 2020.
European Integration VI Core Policy 2Common Agricultural Policy (CAP) Top 5 World Agricultural Exporters Top 5 World Agricultural Importers EU-27 - Main Agricultural Exports, 2011 EU-27 - Main Agricultural Imports, 2011 Source: http://ec.europa.eu/agriculture/publi/map/01_12_en.pdf
European Integration VI Core Policy 2Common Agricultural Policy (CAP) Source: EUROSTAT (2011), External and Intra-EU Trade, edition 2010, p 21.
European Integration VI Core Policy 2Common Agricultural Policy (CAP) EU-27 - Agricultural Exports by Destination EU-27 - Agricultural Imports by Origin EU-27 – Trade with USA EU-27 – Trade with Russia Source: http://ec.europa.eu/agriculture/publi/map/01_12_en.pdf
European Integration VI Core Policy 2Common Agricultural Policy (CAP)
European Integration VI Core Policy 2Common Agricultural Policy (CAP) • The member states of the EEC in Article 39 of the Treaty establishing the • European Community (signed on March 25, 1957) agreed that the objectives • of the Common Agricultural Policy (CAP) should be: • “to increase agricultural productivity by promoting technical progress and • by ensuring the rational development of agricultural production and the • optimal utilization of the factors of production, in particular labor; • thus to ensure a fair standard of living for the agricultural community, • in particular by increasing the individual earnings of persons engaged in • agriculture; • (c)to stabilize markets; • (d)to assure the availability of supplies; • (e)to ensure that supplies reach consumers at reasonable prices.”
European Integration VI Core Policy 2Common Agricultural Policy (CAP) • The member states were aware of • ”the particular nature of agricultural activity,which results from the social • structure of agriculture and from structural and natural disparities between • the various agricultural regions; • (b) the need to effect the appropriate adjustments by degrees…” (Article 39, 2.). • The member states agreed that a common organization of agricultural markets • should be established. They opted for three different types depending on the • product: • (a)“common rules on competition; • (b)compulsory coordination of the various market organizations; • a European market organization.” (Article 40, 2.) • The Common Agricultural Policy (CAP) was originally a market organization system • but later replaced the market mechanism by • - guaranteed administrative minimum prices, and • - protectionist trade barriers • This system contrasts to the direct income supporting system (US system).
European Integration VI Core Policy 2Common Agricultural Policy (CAP) In the case of administrative fixed prices, farmers are guaranteed a certain price for their products, which lies above the world market price (otherwise the floor price would not be binding). Such a support strategy can only be realized through a combination of external and domestic measures: on the one hand, cheaper imports, which might drive down the administrative price, have to be prevented (by external measures such as tariffs). On the other hand, intervention into the domestic market mechanism becomes necessary to maintain a given price level (by domestic measures, e.g. intervention buying or output restrictions). In the EU the initial policy instrument was the setup of such an administrative fixed market price above the domestic equilibrium price. For a long time, there had been no output restrictions imposed because of the initial goal of self-sufficiency in food supply. As producers no longer bore a price risk this strategy set an incentive to expand production to increase producer income (equal to the fixed price times production quantity). If the price cannot react, the income elasticity of the demand for agricultural goods is low and foreign markets are relatively closed, surpluses are something like an inevitable result of such a policy.These surpluses have to be taken from the market by policy intervention to maintain the administrative price, e.g. by buying the surplus or by paying a premium for discarding agricultural products.Governments can also attempt to reduce surpluses by setting output restrictions in the form of positive incentives for reductions or penalties for excessive production.
European Integration VI Core Policy 2Common Agricultural Policy (CAP) If the domestic agricultural sector is open to the world market, which has a lower price than the administrative one (and maybe also lower than the domestic equilibrium price), this price can only be sustained by protectionist measures at the border. The most commoninstrument to achieve this is a tariff, which increases import prices by a certain percentage of import value. Domestic producers are protected from foreign competition if the tariff is high enough to raise import prices to the domestic price level. This means that with constant tariffs, declining world market prices diminish protection. In that case, the administrative authority has to bring the tariff in line with the new world market price. By setting up minimum prices, inefficient domestic producers are sustained leading to a loss in international sector competitiveness. Furthermore, this policy can lead to excess production. In order to reduce surpluses the administrative authority can either purchase excess quantities or subsidize their export. Such a strategy of tariffs and export subsidies is highly trade distorting. On the one hand, imports are kept out of the market. Combined with subsidized exports, this increases worldwide supply of agricultural products driving world market prices down. Farmers in other export countries might lose their competitiveness facing this new, artificially lowered price. Importing countries in contrast are the winners.
European Integration VI Core Policy 2Common Agricultural Policy (CAP) Taken together, there are a number of winners and losers from such a protectionist strategy. On the winning side are: farmers (higher incomes), consumers outside the protectionist country (lower world market prices) and to some extent the government itself (generating tariff revenue from agricultural imports). On the losing side, one finds: consumers in the protectionist country (paying excessive prices and higher taxes to finance market intervention), farmers in this country (paying higher taxes to finance market intervention), producers in exporting countries (lower world market prices, loss of the EU as a major market) and to some extent the government itself (facing higher expenditure from marketintervention). Although exact quantities of welfare loss are difficult to determine, this short overview already indicates that the overall welfare losses from such a protectionist strategyexceed the gains (especially when considering that within the EU, the group of mainbenefactors, i.e. farmers, is by far smaller than that of the main ‘losers’,i.e. consumers).
European Integration VI Core Policy 2Common Agricultural Policy (CAP) Direct income paymentsof government to farmers are a completely different support system and can come in a variety of ways. These range from direct payments (that can be headage payments or related to current or historical input or output levels) to indirect payments (e.g. taxexemptions). They differ from guaranteed price support systems insofar as, there is no necessity to protect the domestic market. This implies that they are far less trade-distorting than the administrative price system (i.e. the negative welfare effects on non-domestic parties described above do not occur). If the market is open, the domestic price level equals the world market level because otherwise imports would rise, thereby equalizing price levels. Direct income payments then allow farmers to close the gap between their income at world market prices and production costs. In the end, one has to take into account that these income payments have to be financed, e.g. by taxes. In that case consumers and producers have to bear the costs. However, consumers benefit compared to a minimum price because they can buy agricultural commodities at world market prices. Regarding farmers, the support and protection function of direct income payments is less perfect than that of a combined minimum price/tariff system: The exposure of the producers to price changes in the world market is relatively high. Furthermore, the adaptability of subsidies to changes in the world market seems to be lower than the adaptability of minimum prices and tariffs. From a welfare perspective this system of direct income payments is less negative than the administrative minimum price: on the one hand, consumers no longer pay twice and on the other hand, negative effects on other countries (through trade distortions) are reduced. Although these two support systems are at the heart of agricultural support in industrialized countries, reality is far more complex. Different factors contribute to the complexity of any analysis of agricultural markets: Policies across different product categories and within the same country differ significantly. This is why general statements about the agricultural market even within one country are difficult. Policies within one product category differ internationally. This is why it is difficult to compare levels of protection between countries. Policies within one product category typically comprise a complex set of tools. Policies have changed significantly throughout history.
Common Agricultural Policy (CAP) The first model of European market organization
The evolving role of EU support prices - wheat Source: Haniotis, T.
Three views of benefits and costs of the CAP An evaluation of the effects of the CAP could be based on different approaches. Firstly, the traditional analysis of trade distortions uses an efficiency-oriented approachto quantify the welfare effects for domestic and foreign farmers as well as consumers. Players outside the agricultural market, their behavior and the effects on the pattern of protection are excluded (e.g. tax payers). Secondly, “political economy”-models of protection focus on distribution-oriented considerations. The main players are political decision-makers and interest groups. It is assumed that both groups pursue their own interests. Politicians use their regulatory power to transfer income to the “clients” of the special interest groups, e.g. to the farmers. Tariffs are seen as political instead of economic prices. Several alternativemodels have been developed especially in the USA; some have been tested successfully (Grossman/Helpman 1994; Baldwin/Magee 1998; Eicher/Osang 2002). And thirdly, these two approaches might be supported by plausible intuition where models resulting in exactly determined effects have its limits.
Agricultural expenditures CAP cost, 2008, absolute terms CAP cost, 2008, relative terms 44% of EU budget 0.43% of EU GDP
Markets Modulation The CAP Reform Markets Pillar I Direct payments Pillar II Rural Development Haniotis, T, The CAP Reform Process in Perspective: Issues ot the Post-2013 Debate. European Commission Slide 20-22.
The road of the EU’s CAP reforms: Decoupling production and support • The 1992 reform (MacSharry reform) • reduction of intervention prices, • - increase in income supports under the condition of setting productive • land aside, • discriminating the level of income support between large and small farms to • the advantage of the former, • compensation for an early retirement of farmers older than 55 years, • paying more attention to product quality, • subsidies for farmers who have to cope with disadvantageous local • conditions, • - environmental improvements by taking into account that protection of • nature increases the quality of life.
Impact of the CAP reform on expenditure structure in the cereals sector* - A clear shift from market intervention (export refunds and storage intervention) to direct aid
Impact of CAP reforms on EU net production surplus Net production surplus as % of consumption
CAP Reform 2014-2020 The CAP Post-2013: From Challenges to Reform Objectives Source slides 37-45: EC (2013), Overview of CAP Reform 2014-2020, http://ec.europa.eu/agriculture/cap-post2013/
CAP Budget Pillar 1: Direct payment and market-related expenditure Pillar 2: Rural development Pillar 1 and 2: 38.7% of total EU budget 2014-2020 Pillar 1: Minus 1.8% Pillar 2: Minus 7.6%
CAP Actual Payments 1990-2012, Commitments for 2013 and the New MFF Ceilings 2014-2020 “The radical change in the orientation of the CAP is demonstrated by the evolution of expenditure, echoing the policy shift since 1992, away from product based support towards producer support and considerations for the environment.” MFF = Multiannual Financial Framework 2014-2020 (EU Budget)
CAP 2014-2020 • New Features • Joint provision of public and private goods “Farmers should be rewarded for the services they deliver to the wider public, such as landscapes, farmland biodiversity, climate stability even though they have no market value. Therefore, a new policy instrument of the first pillar (greening) is directed to the provision of environmental public goods, which constitutes a major change in the policy framework.” • Efficient, targeted and coherent “Both pillars of the CAP are aimed at meeting all three CAP objectives more effectively, with better targeted instruments of the first pillar complemented by regionally tailor-made and voluntary measures of the second pillar. “ • New flexibility “… in the budgeting and implementation of first Pillar instruments, acknowledging the wide diversity of agriculture, agronomic production potential and climatic, environmental as well as socio-economic conditions and needs across the EU. This flexibility will however be framed by well-defined regulatory and budgetary limits in order to ensure a level-playing field at European level and that common objectives are met.”
CAP 2014-2020 • How the key objectives of the reform are addressed • Enhanced competitiveness of EU agriculture “Competitiveness is addressed directly by changes to market mechanisms, particularly the removal of production constraints. All of the existing restrictions on production volumes for sugar, dairy and the wine sector will end, allowing farmers to respond to growing world demand. Measures to facilitate producer cooperation under both pillars of the CAP should also boost the competitiveness of farming by reducing costs, improving access to credit and adding value to the primary sector. A new crisis reserve (of EUR 400million per year in 2011 prices) is established to secure the financial resources needed in case of crisis, through deductions from direct payments, with unused amounts reimbursed to farmers in the consecutive budget years. “ • A more sustainable EU agriculture
CAP 2014-2020 • A more effective and efficient CAP • … through more targeted and equitable direct payments New design of direct payments
CAP 2014-2020 “The performance of the CAP will also benefit from a more balanced, transparent and more equitable distribution of direct payments among countries and among farmers. The reduction in disparities of the level of direct payments between Member States, known as external convergence, will reinforce the credibility and legitimacy of the support system at EU level. Changes in the distribution of direct payments Baseline: Average national payments per hectare by 2020 compared to teh status quo.
CAP 2014-2020 • …and a more strategic approach to R&D spending Rural development policy
CAP 2014-2020 • Actions targeted under both pillars
CAP 2014-2020 SUMMARY