Download
1 / 9
90 likes | 170 Views
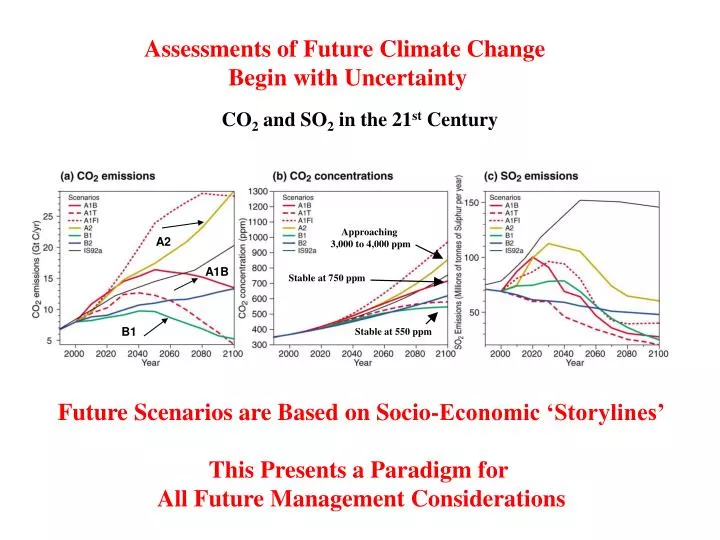
Assessments of Future Climate Change Begin with Uncertainty. CO 2 and SO 2 in the 21 st Century. Approaching 3,000 to 4,000 ppm. A2. A1B. Stable at 750 ppm. B1. Stable at 550 ppm. Future Scenarios are Based on Socio-Economic ‘Storylines’ This Presents a Paradigm for

E N D
Assessments of Future Climate Change Begin with Uncertainty CO2 and SO2 in the 21st Century Approaching 3,000 to 4,000 ppm A2 A1B Stable at 750 ppm B1 Stable at 550 ppm Future Scenarios are Based on Socio-Economic ‘Storylines’ This Presents a Paradigm for All Future Management Considerations Source: IPCC TAR 2001
But note the slope of Past Compared to Future Temperature Change Variations of the Earth’s Surface Temperature: 1000 to 2100 Similar to Glacial – Interglacial Temperature Change Uncertainty is due to both Emissions Scenarios and Climate Models • 1000 to 1861, N. Hemisphere, proxy data; • 1861 to 2000 Global, Instrumental; • 2000 to 2100, SRES projections
Annual Temperature (C) Year Summer (June – Aug) Precipitation (mm) Winter (Sept – May) Year
Observed Simulated Historical
Historical A2 A1B B1 MIROC3_MEDRES HADCM3 CSIRO_MK3
Tundra Subalpine Forest Mar. Ev. Needl. For. Temp. Ev. Need. For. Temp. Dec. Br. For. Tmp. Ev. Need. Wood. Temperate Shrubland Temperate Grassland Subtrop. Mix. Forest
A2 A1B B1 MIROC3_MEDRES HADCM3 CSIRO_MK3 gC / m2 Difference in Biomass consumed by Fire 2051-2100 vs. 1951-2000.
A2 A1B B1 MIROC3_MEDRES HADCM3 CSIRO_MK3 percent Percent Change Biomass consumed by Fire 2051-2100 vs. 1951-2000.
A2 A1B B1 MIROC3_MEDRES HADCM3 CSIRO_MK3 percent Percent Change in Vegetation Carbon 2070-2099 vs. 1961-1990.