Download
1 / 11
110 likes | 249 Views
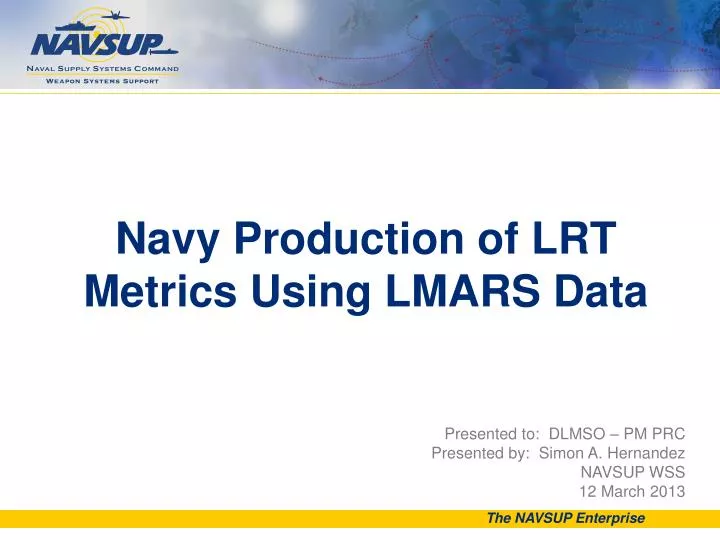
Navy Production of LRT Metrics Using LMARS Data. Presented to: DLMSO – PM PRC Presented by: Simon A. Hernandez NAVSUP WSS 12 March 2013. The NAVSUP Enterprise. Purpose and Reports.

E N D
Navy Production of LRT Metrics Using LMARS Data Presented to: DLMSO – PM PRC Presented by: Simon A. Hernandez NAVSUP WSS 12 March 2013 The NAVSUP Enterprise
Purpose and Reports We process LMARS data to create LRT standard monthly reports and ad hoc analyses for many customers; including DOD, OPNAV, NAVSUP HQ, Fleet, and others internal and external to WSS. Here are examples of monthly reports : FOT&E Fleet Report Cards on LRT CASREP Report LRC Aviation Report LRC Maritime Report Impact Analysis 2
Reports FOT&E: LRT ISPT was identified as a Key Performance Parameter (KPP) for the successful implementation of Navy ERP. Follow-on Operational Test and Evaluation (April 2013) will review the performance of Navy cog ISPT to determine how well NAVSUP WSS is functioning using ERP as compared to predetermined goals and thresholds. 3
FOT&E Maritime Consumables Maritime Repairables R Y G R Y G Aviation Consumables Aviation Repairables R Y R G Y G 4
Reports Fleet Report Cards on LRT: All 5 LRT nodes are shown in groups of 5 consecutive rows, --- for each of the ships, --- for CASREPs, NMCS/PMCS, and 'other' --- broken out by Immediate Issues vs. Backorders. Two Fleet Report Cards on LRT are created every month: One year window - Includes last 12 months. Current Month - Includes the previous month only. 5
Reports • CASREP Report: Divided in 4 documents, • Stats: contains one month of LRC summary statistics broken out in many categories. (i.e. by Enterprise, by Severity, etc.) • Raw Data: This raw data file contains all Noncannibalization CASREP LRC documents for one month. These are all of the CASREP material receipts that were in-processed by DAASC during one month. • CAS File: This file contains all "W" series documents (i.e., BOTH Cannibalizations and Noncannibalizations) that completed ANY of the 5 LRT nodes during one month. This complete raw dataset is the information source for the newly developed CASREP menu-driven CIS system. • Box & Whisker Charts: showing the most recent 12 months (individually) of CASREP Requisition LRT. These slides pertain only to Non-Cannibalizations. • Slide 1 is for "All Cogs, Ships UICs" . • Slide 2 is for "All Cogs, All UICs". • Slide 3 is for "WSS COGS, ALL UICs“. 7
Reports Impact Analysis: Reveals best and worst actor in a specific LRT node during a period of time. It shows what impact an item had in a node. This report can be done by LRC, NIIN, UIC, etc. 9
Summary NAVSUP WSS processes the LMARS data and produces valuable analyses to various customers around the world. LRT is a very important metric used in the analysis of the Navy’s Wholesale Supply System on a day-to-day basis. Various LRT metrics are used extensively to manage how well we are filling customer requisitions. 11