Download
1 / 49
500 likes | 513 Views
Understanding Statistical Inference. Dr Nic Petty. Statistics through primary and early secondary. Dr Nic Petty. NZAMT2019. Introductions. Creative Maths (including Statistics Learning Centre) is a social enterprise.

E N D
Understanding Statistical Inference Dr Nic Petty
Statistics through primary and early secondary Dr Nic Petty NZAMT2019
Introductions Creative Maths (including Statistics Learning Centre) is a social enterprise. We create and disseminate resources and ideas so people can learn and teach mathematics and statistics more enjoyably and more effectively. • Dr Nic • Teacher, lecturer, PhD, maths whisperer • Blog – teaching stats and maths • YouTube channel – over 1.5 million views per year • Game creator
And who are you? • Love maths • Maths is ok • Don’t really like maths • Years 0 - 4 • Years 5 - 6 • Years 7 - 8 • Years 9 -10 • Years 11 - 13 ? • 1 or 2 years • 3 to 10 years • 11 to 20 years • More than 20 years • Love statistics • Statistics is ok • Don’t really like statistics (yet)
What was offered • Statistics is a wonderful opportunity for cross-curricular learning, as well as combining with various strands of mathematics. In this hands-on workshop, you will take part in a statistical activity involving data cards, which can be used at all levels of the curriculum. We will also look at what is important at each of the levels of the curriculum and answer any questions you have about statistics.
By the end of this you will… • Feel empowered to teach statistics • Be more aware of connections between maths, stats and other subjects • See how data cards can enliven a statistics programme
The plan (loose) • Relationship between maths and stats • Datacards • One dragon, many dragons • Exploring a comparison question • Your thoughts – reflection, ideas for datacards • Curriculum progression: when does it happen, other topics • What matters – the emphasis • Resources available • Questions answered
Your thoughts - Discuss with neighbour • What is statistics all about? • In what aspects is teaching statistics different from teaching mathematics? • Any questions – write them and I’ll answer later
Dragonistics data cards (Works with other data cards too)
One dragon each – on your own • What do you know for sure? • What do you think might be the case? • What questions do you have? • What questions can be answered with one card? • What more could you find out if you had more cards? • How many cards do you need? • What questions can not be answered with the cards?
In groups of 3 or 4 • What do you know for sure? • What do you think might be the case? • What questions do you have? • What questions can be answered with three or four cards? • What more could you find out if you had more cards? • How many cards do you need? • What questions can not be answered with the cards? How are your answers different when you have more cards?
Behaviour and species • We suspect that there might be a difference in behaviour between the species. • How could we find that out? This is an example of a comparison question. We are comparing the behaviours for the two different species.
Behaviour and species What conclusions can we draw? How could we communicate this? What other mathematics are we using? What other skills?
Reflection time • What ideas are you getting about using data cards? • Could you make your own? • What other subjects could be linked?
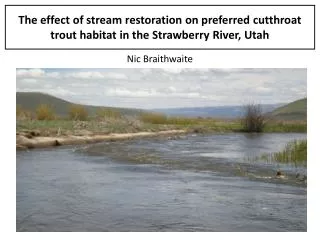
Data card examples • Dragon cards Census@Schools Kiwi Capers Creative Maths Anna Fergusson Pip Arnold • Trout Jim Hogan
Where is the emphasis? • Process • Thinking • Communication • Asking good questions • Analysing graphs – reading beyond the graph – see https://learnandteachstatistics.wordpress.com/2016/05/09/graph_reading/ • Reading tables
Statistics: Horizon content knowledge • Where the curriculum is going. • Why do you need this?
The aim was for you to… • Feel empowered to teach statistics • Be more aware of connections between maths, stats and other subjects • See how data cards can enliven a statistics programme
Resources available • Census at School • Creative Maths has lesson plans and videos • https://creativemaths.net/videos/ • Figure it out books – include data cards • NZMaths site
Statistical Inference We want to know about the weights of the apples in the orchard… …so we take a sample of apples and weigh them…. …and use that information to draw conclusions about the weights of apples in the whole orchard.
NZ Curriculum Level 1 Individual story – how do they relate to the data • Statistical investigation • Conduct investigations using the statistical enquiry cycle: • posing and answering questions • gathering, sorting and counting, and displaying category data • discussing the results. • Statistical literacy • Interpret statements made by others from statistical investigations and probability activities. • Probability • Investigate situations that involve elements of chance, acknowledging and anticipating possible outcomes.
NZ Curriculum Level 2 Moving towards telling the class story • Statistical investigation • Conduct investigations using the statistical enquiry cycle: • posing and answering questions • gathering, sorting, and displaying category and whole-number data • communicating findings based on the data. • Statistical literacy • Compare statements with the features of simple data displays from statistical investigations or probability activities undertaken by others. Teachers should be encouraging students to read beyond the data by asking questions such as: “If a new student joined our class, how many children do you think would be in their family?”
NZ Curriculum Level 3 Telling the class story with evidence • Statistical investigation • Conduct investigations using the statistical enquiry cycle: • gathering, sorting, and displaying multivariate category and whole-number data and simple time-series data to answer questions • identifying patterns and trends in context, within and between data sets • communicating findings, using data displays. • Statistical literacy • Evaluate the effectiveness of different displays in representing the findings of a statistical investigation or probability activity undertaken by others. Teachers should be encouraging students to read beyond the data by asking questions such as: “If a new student joined our class, how many children do you think would be in their family?”
NZ Curriculum Level 4 • Statistical investigation • Plan and conduct investigations using the statistical enquiry cycle: • determining appropriate variables and data collection methods • gathering, sorting, and displaying multivariate category, measurement, and time-series data to detect patterns, variations, relationships, and trends • comparing distributions visually • communicating findings, using appropriate displays. • Statistical literacy • Evaluate statements made by others about the findings of statistical investigations and probability activities. Comparison and relationship investigative questions will be posed and explored. Comparison investigative questions need to be about the group of interest and have an aggregate focus. For example, do the boys in our class tend to be taller than the girls in our class? Is there a relationship between armspan length and height for the students in our class?
NZ Curriculum Level 5 • Statistical investigation • Plan and conduct surveys and experiments using the statistical enquiry cycle: • determining appropriate variables and measures • considering sources of variation • gathering and cleaning data • using multiple displays, and re-categorising data to find patterns, variations, relationships, and trends in multivariate data sets • comparing sample distributions visually, using measures of centre, spread, and proportion • presenting a report of findings. • Statistical literacy • Evaluate statistical investigations or probability activities undertaken by others, including data collection methods, choice of measures, and validity of findings. telling a story about the wider universe with supporting evidence. Students will be posing investigative questions about populations and using samples to answer these.
NZ Curriculum Level 6 • Statistical investigation • Plan and conduct investigations using the statistical enquiry cycle: • justifying the variables and measures used • managing sources of variation, including through the use of random sampling • identifying and communicating features in context (trends, relationships between variables, and differences within and between distributions), using multiple displays • making informal inferences about populations from sample data • justifying findings, using displays and measures. • Statistical literacy • Evaluate statistical reports in the media by relating the displays, statistics, processes, and probabilities used to the claims made.
NZ Curriculum Level 7 • Statistical investigation • Carry out investigations of phenomena, using the statistical enquiry cycle: • conducting surveys that require random sampling techniques, conducting experiments, and using existing data sets • evaluating the choice of measures for variables and the sampling and data collection methods used • using relevant contextual knowledge, exploratory data analysis, and statistical inference. • Make inferences from surveys and experiments: • making informal predictions, interpolations, and extrapolations • using sample statistics to make point estimates of population parameters • recognising the effect of sample size on the variability of an estimate.
NZ Curriculum Level 7 • Statistical literacy • Evaluate statistically based reports: • interpreting risk and relative risk • identifying sampling and possible non-sampling errors in surveys, including polls. • Probability • Investigate situations that involve elements of chance: • comparing theoretical continuous distributions, such as the normal distribution, with experimental distributions • calculating probabilities, using such tools as two-way tables, tree diagrams, simulations, and technology.
NZ Curriculum Level 8 • Statistical investigation • Carry out investigations of phenomena, using the statistical enquiry cycle: • conducting experiments using experimental design principles, conducting surveys, and using existing data sets • finding, using, and assessing appropriate models (including linear regression for bivariate data and additive models for time-series data), seeking explanations, and making predictions • using informed contextual knowledge, exploratory data analysis, and statistical inference • communicating findings and evaluating all stages of the cycle. • Make inferences from surveys and experiments: • determining estimates and confidence intervals for means, proportions, and differences, recognising the relevance of the central limit theorem • using methods such as resampling or randomisation to assess the strength of evidence.
NZ Curriculum Level 8 • Statistical literacy • Evaluate a wide range of statistically based reports, including surveys and polls, experiments, and observational studies: • critiquing causal-relationship claims • interpreting margins of error. • Probability • Investigate situations that involve elements of chance: • calculating probabilities of independent, combined, and conditional events • calculating and interpreting expected values and standard deviations of discrete random variables • applying distributions such as the Poisson, binomial, and normal.
Graph reading progression • Reading about the graph • Identifying one piece of data • Reading off the graph • Reading within the graph • Reading beyond the graph, beyond the data • Judging the graph
Task – leads to statistical inference in later years • Scenario • We want to breed tall dragons for a sporting event (dragon basketball) and need to know if we should go for red dragons or green dragons. We think the green ones tend to be taller, but they are more expensive to feed so if the red ones are just as tall, we would rather breed red dragons.
Claims • How would you go about proving or disproving them? • How would your students go about them? • What would constitute evidence to prove or disprove? • Order the claims according to difficulty
Some of the claims • “There are more green dragons than red dragons.” • “Changeable dragons are less common than friendly or dangerous dragons.” • “There are more dragons younger than 200 than older than 200.” • A dragon team trainer says that teams of two dragons chosen at random nearly always have a combined strength of between 7 and 11. Is this true?