Download
1 / 16
160 likes | 218 Views
The Stock Cycle versus The Bond Cycle Two cycles out of phase with one another. The Stock Cycle versus The Bond Cycle In terms of prices, bond prices seem to lead stock prices. The Stock Cycle versus The Bond Cycle

E N D
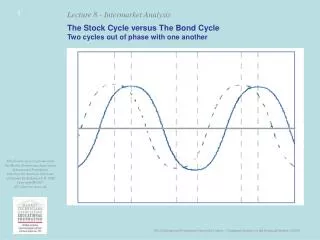
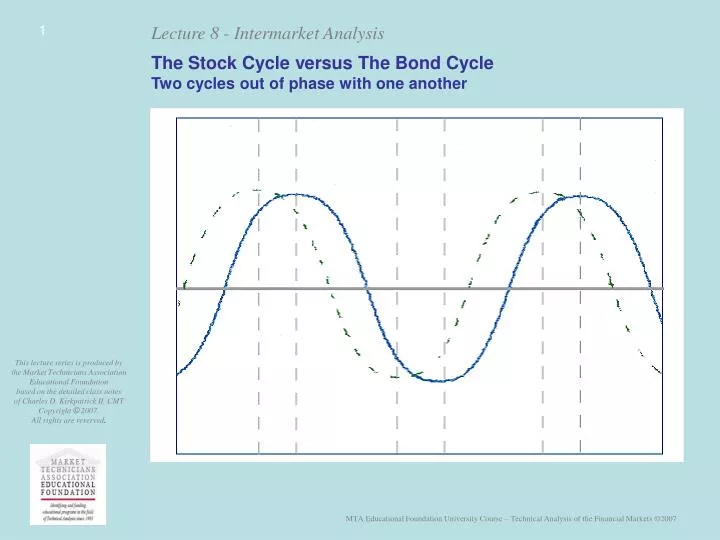
The Stock Cycle versus The Bond Cycle Two cycles out of phase with one another
The Stock Cycle versus The Bond Cycle In terms of prices, bond prices seem to lead stock prices
The Stock Cycle versus The Bond Cycle But, stocks lead interest rates. Remember: interest rates = the inverse of bond prices
The Stock Cycle versus The Bond Cycle It is easiest to understand the relationship referring to stock prices and bond prices
The Stock Cycle versus The Bond Cycle Phase 1:Bonds up, stocks down When the economy is weak, bonds usually do better than stocks for a while because the earnings environment is poor. Phase 2:Bonds up, stocks up Then stocks start to move up because lower interest rates get investors to buy in anticipation of an improved economy and, therefore, better earnings.
The Stock Cycle versus The Bond Cycle Phase 3:Bonds down, stocks up Later the economy is actually strengthening, with increased credit demand and improved pricing, and earnings are rising. Phase 4:Bonds down, stocks down Eventually, higher interest rates cause investors to be concerned that economic activity and, therefore, earnings will soon weaken.
Hypothetical Business Cycle Showing Peaks & Troughs S G B Expansion Recession G B B = Bonds S = Stocks G = Gold* S *Gold - used as a proxy for all commodities Source: “Technical Analysis Explained,” Martin Pring
Interaction of Financial Markets During a Typical Business Cycle Business cycle peak Bond Market Stock Market Gold* Business cycle trough Source: “Technical Analysis Explained,” Martin Pring *Gold - used as a proxy for all commodities
Four Markets: Stocks, Bonds, Commodities and Currencies CRB Index 30-Year Treasuries US Dollar Index S&P 500
Bonds and Stocks Move in the Same Direction Some Times and in the Opposite Direction Other Times S&P 500 30-Year Treasuries StockCharts.com
Treasury Bonds and the CRB Index In the post 2002 bull market, rising commodity prices were not translated into inflation in the U.S. 30-Year Treasuries CRB Index StockCharts.com
The U.S. Dollar Index and the CRB Index Usually Move in Opposite Directions US Dollar Index CRB Index StockCharts.com
Gold and the U.S. Dollar Have a Strong Inverse Correlation US Dollar Index Gold StockCharts.com
Treasury Bonds and the Dow Jones Utility Index Tend to Move in the Same Direction US Treasuries Utility Index StockCharts.com
Cyclical Stocks Compared to Consumer Stocks The Rising Ratio Indicates Cyclical Stock Outperformance Morgan Stanley Cyclical Index Morgan Stanley Consumer Index Ratio: Cyclical ÷ Consumer StockCharts.com