Download

1 / 131
1.32k likes | 1.41k Views
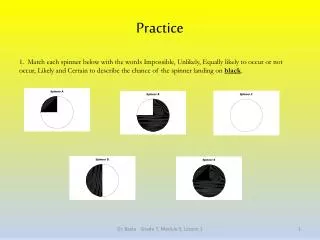
Practice. You are interested in how citizens of the US feel about the president. You asked 8 people to rate the president on a 10 point scale. Describe how the country feels about the president -- be sure to report a measure of central tendency and the standard deviation.

E N D
Practice • You are interested in how citizens of the US feel about the president. You asked 8 people to rate the president on a 10 point scale. Describe how the country feels about the president -- be sure to report a measure of central tendency and the standard deviation. 8, 4, 9, 10, 6, 5, 7, 9
Central Tendency 8, 4, 9, 10, 6, 5, 7, 9 4, 5, 6, 7, 8, 9, 9, 10 Mean = 7.25 Median = (4.5) = 7.5 Mode = 9
Standard Deviation 452 58 8 8 - 1 -1
Standard Deviation 58 452 8 8 - 1 -1
Standard Deviation 452 420.5 7 -1
Standard Deviation 2.12 -1
Variance • The last step in calculating a standard deviation is to find the square root • The number you are fining the square root of is the variance!
Variance S2 =
Variance S2 = - 1
Practice • Below are the test score of Joe and Bob. What are their means, medians, and modes? Who tended to have the most uniform scores (calculate the standard deviation and variance)? • Joe 80, 40, 65, 90, 99, 90, 22, 50 • Bob 50, 50, 40, 26, 85, 78, 12, 50
Practice • Joe 22, 40, 50, 65, 80, 90, 90, 99 Mean = 67 • Bob 12, 26, 40, 50, 50, 50, 78, 85 Mean = 48.88
Practice • Joe 22, 40, 50, 65, 80, 90, 90, 99 Median = 72.5 • Bob 12, 26, 40, 50, 50, 50, 78, 85 Median = 50
Practice • Joe 22, 40, 50, 65, 80, 90, 90, 99 Mode = 90 • Bob 12, 26, 40, 50, 50, 50, 78, 85 Mode = 50
Practice • Joe 22, 40, 50, 65, 80, 90, 90, 99 S = 27.51; S2 = 756.80 • Bob 12, 26, 40, 50, 50, 50, 78, 85 S = 24.26; S2 = 588.55 Thus, Bob’s scores were the most uniform
Review • Ways to “see” data • Simple frequency distribution • Group frequency distribution • Histogram • Stem-and-Leaf Display • Describing distributions • Box-Plot • Measures of central tendency • Mean • Median • Mode
Review • Measures of variability • Range • IQR • Standard deviation • Variance
What if. . . . • You recently finished taking a test that you received a score of 90 and the test scores were normally distributed. • It was out of 200 points • The highest score was 110 • The average score was 95 • The lowest score was 90
Z-score • A mathematical way to modify an individual raw score so that the result conveys the score’s relationship to the mean and standard deviation of the other scores • Transforms a distribution of scores so they have a mean of 0 and a SD of 1
Z-score • Ingredients: X Raw score Mean of scores S The standard deviation of scores
What it does • x - Tells you how far from the mean you are and if you are > or < the mean • S Tells you the “size” of this difference
Example • Sample 1: X = 8 = 6 S = 5
Example • Sample 1: X = 8 = 6 S = 5 Z score = .4
Example • Sample 1: X = 8 = 6 S = 1.25
Example • Sample 1: X = 8 = 6 S = 1.25 Z-score = 1.6
Example • Sample 1: X = 8 = 6 S = 1.25 Z-score = 1.6 Note: A Z-score tells you how many SD above or below a mean a specific score falls!
Practice • The history teacher Mr. Hand announced that the lowest test score for each student would be dropped. Jeff scored a 85 on his first test. The mean was 74 and the SD was 4. On the second exam, he made 150. The class mean was 140 and the SD was 15. On the third exam, the mean was 35 and the SD was 5. Jeff got 40. Which test should be dropped?
Practice • Test #1 Z = (85 - 74) / 4 = 2.75 • Test #2 Z = (150 - 140) / 15 = .67 • Test #3 Z = (40 - 35) / 5 = 1.00
Did Ross do worse in the endurance challenge than in the throwing challenge? Did Monica do better in the throwing challenge than the endurance?
Practice = 34.6 = 7.4 S = 7.96 S = 2.41
Practice = 34.6 = 7.4 S = 7.96 S = 2.41
Practice = 34.6 = 7.4 S = 7.96 S = 2.41
Ross did worse in the throwing challenge than the endurance and Monica did better in the endurance than the throwing challenge. = 34.6 = 7.4 S = 7.96 S = 2.41
Question • A random sample of 100 students found: • 56 were psychology majors • 32 were undecided • 8 were math majors • 4 were biology majors • What proportion were psychology majors? • .56
Question • A random sample of 100 students found: • 56 were psychology majors • 32 were undecided • 8 were math majors • 4 were biology majors • What is the probability of randomly selecting a psychology major?
Question • A random sample of 100 students found: • 56 were psychology majors • 32 were undecided • 8 were math majors • 4 were biology majors • What is the probability of randomly selecting a psychology major? • .56
Probabilities • The likelihood that something will occur • Easy to do with nominal data! • What if the variable was quantitative?
Probabilities Normality frequently occurs in many situations of psychology, and other sciences
COMPUTER PROG • http://www.jcu.edu/math/isep/Quincunx/Quincunx.html • http://webphysics.davidson.edu/Applets/Galton/BallDrop.html • http://www.ms.uky.edu/~mai/java/stat/GaltonMachine.html
Next step • Z scores allow us to modify a raw score so that it conveys the score’s relationship to the mean and standard deviation of the other scores. • Normality of scores frequently occurs in many situations of psychology, and other sciences • Is it possible to apply Z score to the normal distribution to compute a probability?