Download
1 / 32
320 likes | 528 Views
CENSO 2002. REGION DEL BIO BIO. “Para mejorar la suerte del pueblo, el primer paso es conocerlo a fondo y por desgracia, carecemos de datos estadísticos” Andrés Bello _ Santiago 1835. EVOLUCION DE LA POBLACION REGION DEL BIO BIO.

E N D
CENSO2002 REGION DEL BIO BIO “Para mejorar la suerte del pueblo, el primer paso es conocerlo a fondo y por desgracia, carecemos de datos estadísticos” Andrés Bello _ Santiago 1835
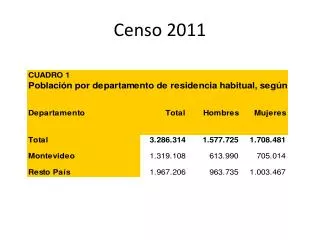
EVOLUCION DE LA POBLACION REGION DEL BIO BIO Tasa de crecimiento anual intercensal 1992-2002: 0,7 %
POBLACION DE 15 AÑOS Y MAS, EN LA FUERZA DE TRABAJO Y FUERA DE ELLA
POBLACION MAYOR DE 15 AÑOS, EN LA FUERZA DE TRABAJO Y FUERA DE ELLA (%)
PORCENTAJE DE OCUPADOS, POR RAMA DE ACTIVIDAD ECONOMICA
NUMERO DE OCUPADOS, POR GRUPOS DE OCUPACION
NUMERO DE OCUPADOS, POR CATEGORIA OCUPACIONAL
PORCENTAJE DE OCUPADOS, POR CATEGORIA OCUPACIONAL
POBLACION Y PORCENTAJE ALFABETA Y ANALFABETA
COMPARACION PORCENTUAL DEL NIVEL DE EDUCACION
DISTRIBUCION DE LA POBLACION POR TIPO DE RELIGION QUE PROFESA
PORCENTAJE DE LAS VIVIENDAS POR ORIGEN DEL ALUMBRADO ELECTRICO
PORCENTAJE DE VIVIENDAS POR ORIGEN DEL AGUA
PORCENTAJE DE LAS VIVIENDAS POR ELIMINACION DE AGUAS SERVIDAS
“Para mejorar la suerte del pueblo, el primer paso es conocerlo a fondo y por suerte, hoy contamos con datos estadísticos”