Download
1 / 43
430 likes | 521 Views
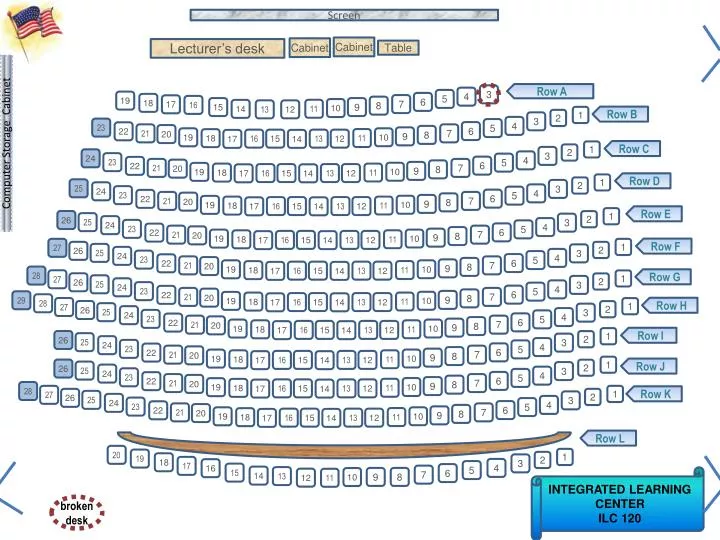
Screen. Cabinet. Cabinet. Lecturer’s desk. Table. Computer Storage Cabinet. Row A. 3. 4. 5. 19. 6. 18. 7. 17. 16. 8. 15. 9. 10. 11. 14. 13. 12. Row B. 1. 2. 3. 4. 23. 5. 6. 22. 21. 7. 20. 8. 9. 10. 19. 11. 18. 16. 15. 13. 12. 17. 14. Row C. 1. 2.

E N D
Screen Cabinet Cabinet Lecturer’s desk Table Computer Storage Cabinet Row A 3 4 5 19 6 18 7 17 16 8 15 9 10 11 14 13 12 Row B 1 2 3 4 23 5 6 22 21 7 20 8 9 10 19 11 18 16 15 13 12 17 14 Row C 1 2 3 24 4 23 5 6 22 21 7 20 8 9 10 19 11 18 16 15 13 12 17 14 Row D 1 2 25 3 24 4 23 5 6 22 21 7 20 8 9 10 19 11 18 16 15 13 12 17 14 Row E 1 26 2 25 3 24 4 23 5 6 22 21 7 20 8 9 10 19 11 18 16 15 13 12 17 14 Row F 27 1 26 2 25 3 24 4 23 5 6 22 21 7 20 8 9 10 19 11 18 16 15 13 12 17 14 28 Row G 27 1 26 2 25 3 24 4 23 5 6 22 21 7 20 8 9 29 10 19 11 18 16 15 13 12 17 14 28 Row H 27 1 26 2 25 3 24 4 23 5 6 22 21 7 20 8 9 10 19 11 18 16 15 13 12 17 14 Row I 1 26 2 25 3 24 4 23 5 6 22 21 7 20 8 9 10 19 11 18 16 15 13 12 17 14 1 Row J 26 2 25 3 24 4 23 5 6 22 21 7 20 8 9 10 19 11 18 16 15 13 12 17 14 28 27 1 Row K 26 2 25 3 24 4 23 5 6 22 21 7 20 8 9 10 19 11 18 16 15 13 12 17 14 Row L 20 1 19 2 18 3 17 4 16 5 15 6 7 14 13 INTEGRATED LEARNING CENTER ILC 120 9 8 10 12 11 broken desk
Please click in My last name starts with a letter somewhere between A. A – D B. E – L C. M – R D. S – Z
Introduction to Statistics for the Social SciencesSBS200, COMM200, GEOG200, PA200, POL200, SOC200Lecture Section 001, Spring, 2012Room 120 Integrated Learning Center (ILC)9:00 - 9:50 Mondays, Wednesdays & Fridays+ Lab Session. Welcome http://www.youtube.com/watch?v=oSQJP40PcGI
Use this as your study guide By the end of lecture today2/13/12 Measures of variability Range, Standard deviation and Variance Memorizing the four definitional formulae Measures of variability Standard deviation and Variance Counting ‘standard deviationses’ – z scores Connecting raw scores, z scores and probabilityConnecting probability, proportion and area of curve Percentiles
Homework Assignment #9 Due Wednesday (February 15th) Please double check – Allcell phones other electronic devices are turned off and stowed away
Schedule of readings Before next exam (March 2nd) Please read chapters 5, 6, & 8 Please read Chapters 10, 11, 12 and 14 in Plous Chapter 10: The Representativeness Heuristic Chapter 11: The Availability Heuristic Chapter 12: Probability and Risk Chapter 14: The Perception of Randomness
It went really well! Exam 1 – This past Friday Thanks for your patience and cooperation We should have the grades up by Friday(takes about a week)
Deviation scores Standard deviation: The average amount by which observations deviate on either side of their mean Diallo is 0” Preston is 2” Mike is -4” Hunter is -2 Shea is 4 David 0” Remember, it’s relative to the mean Generally, (on average) how far away is each score from the mean? Based on difference from the mean Mean Diallo Please memorize these Preston Shea Mike
2 sd above and below mean 95% 1 sd above and below mean 68% 3 sd above and below mean 99.7% This will be so helpful now that we know these by heart
Raw scores, z scores & probabilities 1 sd above and below mean 68% z = +1 z = -1 Mean = 50 S = 10 (Note S = standard deviation) If we go up one standard deviation z score = +1.0 and raw score = 60 If we go down one standard deviation z score = -1.0 and raw score = 40
Raw scores, z scores & probabilities 1.96 sd above and below mean 95% z = -1.96 z = +1.96 Mean = 50 S = 10 (Note S = standard deviation) If we go up two standard deviations z score = +2.0 and raw score = 70 If we go down two standard deviations z score = -2.0 and raw score = 30
Raw scores, z scores & probabilities 3 sd above and below mean 99.7% z = +3 z = -3 Mean = 50 S = 10 (Note S = standard deviation) If we go up three standard deviations z score = +3.0 and raw score = 80 If we go down three standard deviations z score = -3.0 and raw score = 20
z scores z score: A score that indicates how many standard deviations an observation is above or below the mean of the distribution z score = raw score - mean standard deviation
Raw scores, z scores & probabilities The normal curve is defined mostly by its mean, and standard deviation. Once we know that we can figure out a lot z-table (from z to area) Distance from the mean ( from raw to z scores) Raw Scores (actual data) Proportion of curve (area from mean) Given any of these values (score, probability of occurrence, or distance from the mean) and you can figure out the other two.
Scores, standard deviations, and probabilities What is total percent under curve? What proportion of curve is above the mean? .50 100% Given any of these values (score, probability of occurrence, or distance from the mean) and you can figure out the other two.
Scores, standard deviations, and probabilities What score is associated with 50th percentile? What percent of curve is below a score of 50? 50% mean Mean = 50 S = 10 (Note S = standard deviation)
Raw scores, z scores & probabilities Distance from the mean (z scores) convert convert Proportion of curve (area from mean) Raw Scores (actual data) We care about this! What is the actual number on this scale?“height” vs “weight” “pounds” vs “test score” We care about this! “percentiles” “percent of people” “proportion of curve” “relative position” Proportion of curve (area from mean) Raw Scores (actual data) Distance from the mean (z scores) convert convert
1 sd above and below mean 68.26% Raw scores, z scores & probabilities z = +1 z-table (from z to area) Distance from the mean ( from raw to z scores) If we go up to score of 60 we are going up 1.0 standard deviation z = -1 Then, z score = +1.0 Raw Scores (actual data) Proportion of curve (area from mean) z score = 60 – 50 10 10 10 = 1 = Mean = 50 Standard deviation = 10 If we go down to score of 40 we are going down 1.0 standard deviation Then, z score = - 1.0 z score = 40 – 50 10 -10 10 = -1 = z score = raw score – mean standard deviation
2 sd above and below mean 95.44% Raw scores, z scores & probabilities z = +2 z-table (from z to area) Distance from the mean ( from raw to z scores) z = -2 If we go up to score of 70 we are going up 2.0 standard deviations Then, z score = +2.0 Raw Scores (actual data) Proportion of curve (area from mean) z score = 70 – 50 10 20 10 = 2 = Mean = 50 Standard deviation = 10 If we go down to score of 30 we are going down 2.0 standard deviations Then, z score = - 2.0 z score = 30 – 50 10 -20 10 = -2 = z score = raw score – mean standard deviation
3 sd above and below mean 99.7% Raw scores, z scores & probabilities z = +3 z = -3 z-table (from z to area) Distance from the mean ( from raw to z scores) If we go up to score of 80 we are going up 3.0 standard deviations Then, z score = +3.0 Raw Scores (actual data) Proportion of curve (area from mean) z score = 80 – 50 10 30 10 = 3 = Mean = 50 Standard deviation = 10 If we go down to score of 20 we are going down 3.0 standard deviations Then, z score = - 3.0 z score = 20 – 50 10 -30 10 = -3 = z score = raw score – mean standard deviation
Mean = 50 sd = 10 50 60 68% We’re going to want to talk probabilities (area under the curve) for pairs of scores 34% 34% Find the area under the curve that falls between 50 and 60 z-table (from z to area) Distance from the mean ( from raw to z scores) Raw Scores (actual data) Proportion of curve (area from mean) 1) Draw the picture 2) Find z score z score = raw score - mean standard deviation 60 - 50 10 +1.0 = 3) Go to z table - find area under correct column 4) Report the area Hint always draw a picture!
50 60 1) Draw the picture 2) Find z score .3413 3) Go to z table - find area under correct column 4) Report the area Page 377 Find the area under the curve that falls between 50 and 60 60 - 50 10 +1.0 = z score of 1 = area of .3413 Are we done? Yes
50 60 1) Draw the picture 2) Find z score .3413 3) Go to z table - find area under correct column 4) Report the area Find the area under the curve that falls between 50 and 60 60 - 50 10 +1.0 = z score of 1 = area of .3413 Are we done? Yes
Mean = 50 sd = 10 40 50 50 60 68% We’re going to want to talk probabilities (area under the curve) for pairs of scores 34% 34% Find the area under the curve that falls between 40 and 60 z-table (from z to area) Distance from the mean ( from raw to z scores) Raw Scores (actual data) Proportion of curve (area from mean) 1) Draw the picture 2) Find two z scores z score = raw score - mean standard deviation 60 - 50 10 40 - 50 10 +1.0 -1.0 = = 3) Go to z table - find area under correct column 4) Report the area Hint always draw a picture!
40 50 50 60 1) Draw the picture .6826 2) Find z score 3) Go to z table - find area under correct column .3413 .3413 4) Report the area Page 377 Find the area under the curve that falls between 40 and 60 40 - 50 10 -1.0 = z score of -1 = area of .3413 60 - 50 10 +1.0 = z score of 1 = area of .3413 Not Yet Now, we’re done Are we done? .3413 +.3413 = .6826
Ties together z score with Draw picture of what you are looking for... Find z score (using formula)... Look up proportions on table...(Appendix A – page 377) • probability • proportion • percent • area under the curve 68% 34% 34%
Mean = 50 sd = 10 We’re going to want to talk probabilities (area under the curve) for pairs of scores 30 40 50 Find the area under the curve that falls between 30 and 50 z-table (from z to area) Distance from the mean ( from raw to z scores) 1) Draw the picture Raw Scores (actual data) Proportion of curve (area from mean) 30 40 50 2) Find z score z score = raw score - mean standard deviation 30 - 50 10 - 2.0 = 3) Go to z table - find area under correct column 4) Report the area Hint always draw a picture!
Mean = 50 sd = 10 1) Draw the picture 2) Find z score .4772 3) Go to z table - find area under correct column 4) Report the area 30 40 50 Page 377 Find the area under the curve that falls between 30 and 50 30 - 50 10 -2.0 = z score of -2 = area of .4772 Are we done? Yes
50 75 50 75 We’re going to want to talk probabilities (area under the curve) for pairs of scores ? Find the area under the curve that falls between 50 and 75 z-table (from z to area) Distance from the mean ( from raw to z scores) Raw Scores (actual data) Proportion of curve (area from mean) 1) Draw the picture 2) Find z score z score = raw score - mean standard deviation 75 - 50 10 +2.5 = 3) Go to z table - find area under correct column 4) Report the area Hint always draw a picture!
50 75 1) Draw the picture 2) Find z score .4938 3) Go to z table - find area under correct column 4) Report the area Find the area under the curve that falls between 50 and 75 75 - 50 10 +2.5 = z score of 2.5 = area of .4938 Are we done? Yes
50 75 50 75 Mean = 50 sd = 10 We’re going to want to talk probabilities (area under the curve) for pairs of scores ? Find the area under the curve that falls below a score of 75 z-table (from z to area) Distance from the mean ( from raw to z scores) Raw Scores (actual data) Proportion of curve (area from mean) 1) Draw the picture 2) Find z score z score = raw score - mean standard deviation 75 - 50 10 +2.5 = 3) Go to z table - find area under correct column 4) Report the area Hint always draw a picture!
50 75 Mean = 50 sd = 10 .4938 1) Draw the picture 2) Find z score .9938 3) Go to z table - find area under correct column 4) Report the area Find the area under the curve that falls below a score of 75 75 - 50 10 +2.5 = z score of 2.5 = area of .4938 This is the same thing as “Please find the percentile for a score of 75”. Are we done? No Now, we’re done .4938 +.5000 = .9938
50 55 50 55 Mean = 50 sd = 10 We’re going to want to talk probabilities (area under the curve) for pairs of scores ? Please find the percentile rank for a score of 55 z-table (from z to area) Distance from the mean ( from raw to z scores) Raw Scores (actual data) Proportion of curve (area from mean) 1) Draw the picture 2) Find z score z score = raw score - mean standard deviation 55 - 50 10 +0.5 = 3) Go to z table - find area under correct column 4) Report the area Hint always draw a picture!
50 55 Mean = 50 sd = 10 .1915 1) Draw the picture 2) Find z score .6915 3) Go to z table - find area under correct column 4) Report the area Please find the percentile rank for a score of 55 55 - 50 10 +0.5 = z score of 0.5 = area of .1915 Are we done? No Now, we’re done .1915 +.5000 = .6915
45 45 Mean = 50 sd = 10 ? We’re going to want to talk probabilities (area under the curve) for pairs of scores Please find the percentile rank for a score of 45 z-table (from z to area) Distance from the mean ( from raw to z scores) ? Raw Scores (actual data) Proportion of curve (area from mean) 1) Draw the picture 2) Find z score z score = raw score - mean standard deviation 45 - 50 10 -0.5 = 3) Go to z table - find area under correct column 4) Report the area Hint always draw a picture!
.1915 45 45 Mean = 50 sd = 10 1) Draw the picture ? .3085 2) Find z score 3) Go to z table - find area under correct column 4) Report the area Please find the percentile rank for a score of 45 .1915 45 - 50 10 -0.5 = ? .3085 z score of -0.5 = area of .1915 Are we done? No Look at your picture - need to subtract Now, we’re done .5000 - .1915 = .3085
Let’s do some problems ? Mean = 50Standard deviation = 10 30 Hint always draw a picture! Find the score that is associated with a z score of -2 z-table (from z to area) Distance from the mean ( from raw to z scores) Raw score = mean + (z score)(standard deviation) Raw Scores (actual data) Proportion of curve (area from mean) Raw score = 50 + (-2)(10) Raw score = 50 + (-20) = 30
? .5500 ? Mean = 50Standard deviation = 10 Find the score for percentile rank of 55(55th percentile - 55%ile) z-table (from z to area) Distance from the mean ( from raw to z scores) Raw Scores (actual data) Proportion of curve (area from mean) Please note: When we are looking for the score from proportion we use the z-table ‘backwards’. We find the closest z to match our proportion
? .5500 ? Mean = 50Standard deviation = 10 .05 Find the score for percentile rank of 55(55th percentile - 55%ile) .5 .5 .05 1) Go to z table - find z score for for area .0500 (.5500 - .5000) = .05 Please note: When we are looking for the score from proportion we use the z-table ‘backwards’. We find the closest z to match our proportion area = .0517 (closest I could find to .0500) z = 0.13
? .5500 ? Mean = 50Standard deviation = 10 .05 Find the score for percentile rank of 55(55th percentile - 55%ile) .5 .5 .05 1) Go to z table - find z score for for area .0500 (.5500 - .5000) = .05 Please note: When we are looking for the score from proportion we use the z-table ‘backwards’. We find the closest z to match our proportion area = .0517 (closest I could find to .0500) z = 0.13
? .5500 ? Mean = 50Standard deviation = 10 .05 Find the score for percentile rank of 55(55th percentile - 55%ile) .5 x = 51.3 .5 .05 1) Go to z table - find z score for for area .0500 (.5500 - .5000) = .05 area = .0517 (closest I could find to .0500) z = 0.13 2) x = mean + (z)(standard deviation) x = 50 + (0.13)(10) x = 51.3 Please note: When we are looking for the score from proportion we use the z-table ‘backwards’. We find the closest z to match our proportion x = 51.3
Hint: Always draw a picture! Homework worksheet
Thank you! See you next time!!