Download
1 / 23
230 likes | 389 Views
Collaboration. The Central Statistical Agency (CSA ) Ethiopian Development Research Institute (EDRI ) E thiopia Strategy Support Program II (ESSP-II): International Food Policy Research Institute (IFPRI ) The Atlas Geographic Information Systems (GIS) Team:. Yakob Mudesir Sisay Guta

E N D
Collaboration • The Central Statistical Agency (CSA) • Ethiopian Development Research Institute (EDRI) • Ethiopia Strategy Support Program II (ESSP-II): International Food Policy Research Institute (IFPRI) The Atlas Geographic Information Systems (GIS) Team: • Yakob Mudesir • SisayGuta • Emily Schmidt • Mekamu Kedir • Hailu Shiferaw • Atreshiwal Girma • Meron Mebratu • Legesse Hadush • Asfaw Kelbessa • Alemakef Tassew
Collaboration Continues! • We would like to thank: • Ethiopian Mapping Agency • Information Network Security Agency • National Meteorological Agency • In addition, the production of this Atlas was made possible through financial support to ESSP-II of a consortium of donors: • United States Agency for International Development • UK Department for International Development • Canadian International Development Agency • Development Cooperation of Ireland
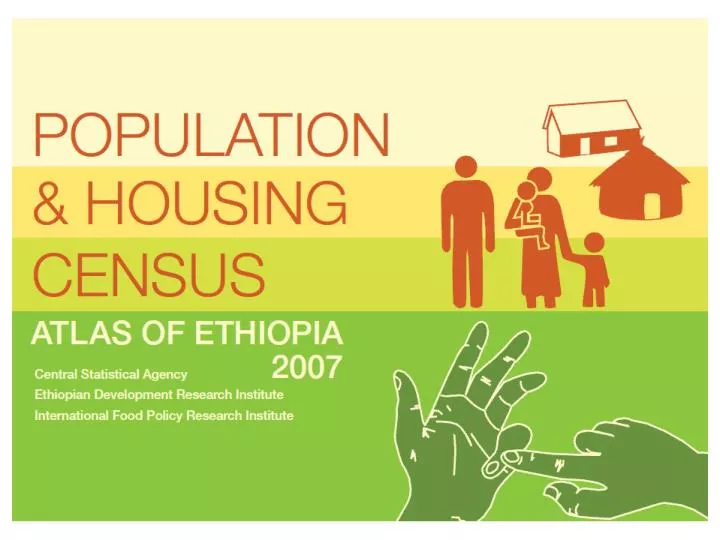
Population and Housing Census Atlas 2007 • Supplements the Census 2007 Report by providing clear graphic depictions of socio-economic characteristics of Ethiopia’s geographic areas • Provides a spatial database in order to facilitate further analysis and research • Supports future planning and helps to illuminate policy debate • Provides better understanding of the spatial dimensions of demographics, poverty, and opportunities for economic growth in Ethiopia
Journey to this Atlas Data preparation and organization Geographic data • CSA delineated and digitized approximately 75,000 enumeration areas (EAs) for census data collection • Seamless geodatabase created, composed of: • EA, Kebele, Woreda, Zone and Region boundaries • Other biophysical features (Lakes, parks and natural reserves ) • Infrastructures- roads Tabular (census) data • Compiled at woreda level and indicators calculated • Indicators merged into a GIS and mapped to highlight spatial clustering and dispersion
Sample snapshot of the Atlas variables POPULATION & HOUSING CENSUS Atlas of Ethiopia 2007
The Atlas is comprised of 7 chapters: • Chapter 1: Census Divisions and Biophysical Context • Chapter 2: Population Size and Characteristics • Chapter 3: Population Composition • Chapter 4: Population by Education Characteristics • Chapter 5: Population Dynamics • Chapter 6: Population by Economic Activity • Chapter 7: Housing Characteristics and Conditions
Each Atlas page contains: • A collection of maps that represent specific census variables • A map legend to explain the magnitude of the variable • A text explanation of the variable being presented • Charts or tables showing Region level comparisons of variables
Major cities cluster along transportation corridors • Woreda road density suggests transportation network more concentrated in the highlands and within higher populated areas
The two most important rains (and harvests) are during the Kiremt and Belg seasons. • The Kiremt rains affect most of the country from July through September, related with the Meher harvest, which constitutes 90 to 95 percent of Ethiopia’s total annual crop production.
Population count shows that population is scattered throughout the country with small clusters of higher population in specific areas of Oromiya, SNNP, and east Somali. • Conversely, the population-density map shows where the population is densest. We see important geographic clustering within the highlands and along major road networks.
Nationally, children 0–9 years old are the predominant age group, accounting for approximately 31 percent of the total population. • People between 10 and 19 years old make up the principal age groups within Somali and Afar (which account for 32 and 30 percent of each region’s population, respectively).
Ethiopia’s principal religions measured by share of total population are Orthodox, Muslim/Islam, and Protestant. • The maps show how major religions are geographically situated across the North, East, West and North axis of the country
Higher primary enrollment rates are generally experienced in the highlands and western regions • Addis Ababa has the highest net enrollment rates at 75 percent respectively.
Higher literacy rates are present in urban areas, and in specific woredas in Gambella region • Addis Ababa has the highest literacy rate; Dire Dawa and Harari have the second and third highest literacy rates.
Overall, Ethiopia has approximately 12.2 million migrants, of which 5.9 million are male and 6.3 million are female • Relative to other major Ethiopian cities, Addis Ababa, Adama, Awassa, and Dire Dawa experience the highest in-migration with more than 100,000 migrants.
Two-thirds of all Ethiopian migrants (66.4 percent) are older than 18 years of age. • Data suggest that migrants younger than 18 years are more likely to live in southern areas of Somali and western areas of Afar and Gambella.
Nationally, self-employment is the most common employment activity in Ethiopia • The employment status of an individual is defined as his or her primary economic activity for the majority of the 12 months prior to the census date
3.8 percent of the population of Ethiopia is unemployed • Unemployment is scattered across the country, with higher shares of unemployment in the east and north of Ethiopia.
Wall construction materials differ geographically based on the primary materials available • Wood and mud as primary building material house 73.6 percent of the national population. • Wood and thatch is the dominant material used for wall construction in Somali and Afar region
Most Ethiopians use a mix of materials for cooking fuel. Because households often use more than one fuel type, use of fuel sources exceeds 100 percent. • Approximately 86.5 percent use firewood as a source of cooking fuel. • Dung as a fuel source is limited mostly to the highland areas of Amhara, Tigray, and Oromiya
How can I obtain a copy of this Atlas? IT IS FREE!! There are 125 copies of the Atlas here, which are being distributed. Otherwise, you can add your name to the request list, and when the second printing is complete in mid-December, we will give you a copy! Or contact: Central Statistical Agency www.csa.gov.et or Mahlet Mekuria or Nahume Yadene Mahlet.Mekuria@cgiar.org Nahume.Yadene@cgiar.org POPULATION & HOUSING CENSUS Atlas of Ethiopia 2007