Download
1 / 1
10 likes | 94 Views
Implementation of an Online Photolysis Module in CMAQ 4.7. Christopher G. Nolte 1 , Shawn J. Roselle 1 , and Francis S. Binkowski 2

E N D
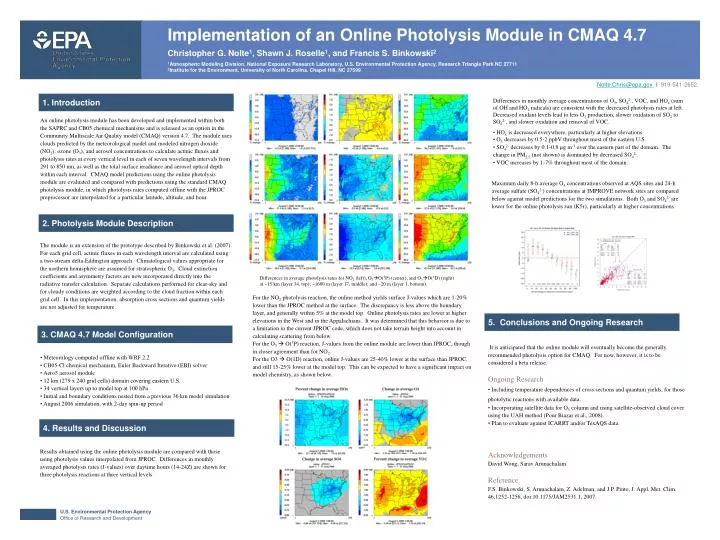
Implementation of an Online Photolysis Module in CMAQ 4.7 Christopher G. Nolte1, Shawn J. Roselle1, and Francis S. Binkowski2 1Atmospheric Modeling Division, National Exposure Research Laboratory, U.S. Environmental Protection Agency, Research Triangle Park NC 27711 2Institute for the Environment, University of North Carolina, Chapel Hill, NC 27599 Nolte.Chris@epa.govl 919-541-2652 1. Introduction • Differences in monthly average concentrations of O3, SO42-, VOC, and HOx (sum of OH and HO2 radicals) are consistent with the decreased photolysis rates at left. Decreased oxidant levels lead to less O3 production, slower oxidation of SO2 to SO42-, and slower oxidation and removal of VOC. • HOx is decreased everywhere, particularly at higher elevations. • O3 decreases by 0.5-2 ppbV throughout most of the eastern U.S. • SO42- decreases by 0.1-0.8 mg m-3 over the eastern part of the domain. The change in PM2.5 (not shown) is dominated by decreased SO42-. • VOC increases by 1-7% throughout most of the domain. An online photolysis module has been developed and implemented within both the SAPRC and CB05 chemical mechanisms and is released as an option in the Community Multiscale Air Quality model (CMAQ) version 4.7. The module uses clouds predicted by the meteorological model and modeled nitrogen dioxide (NO2), ozone (O3), and aerosol concentrations to calculate actinic fluxes and photolysis rates at every vertical level in each of seven wavelength intervals from 291 to 850 nm, as well as the total surface irradiance and aerosol optical depth within each interval. CMAQ model predictions using the online photolysis module are evaluated and compared with predictions using the standard CMAQ photolysis module, in which photolysis rates computed offline with the JPROC preprocessor are interpolated for a particular latitude, altitude, and hour. Maximum daily 8-h average O3 concentrations observed at AQS sites and 24-h average sulfate (SO42-) concentrations at IMPROVE network sites are compared below against model predictions for the two simulations. Both O3 and SO42- are lower for the online photolysis run (K5r), particularly at higher concentrations. 2. Photolysis Module Description The module is an extension of the prototype described by Binkowski et al. (2007). For each grid cell, actinic fluxes in each wavelength interval are calculated using a two-stream delta-Eddington approach. Climatological values appropriate for the northern hemisphere are assumed for stratospheric O3. Cloud extinction coefficients and asymmetry factors are now incorporated directly into the radiative transfer calculation. Separate calculations performed for clear-sky and for cloudy conditions are weighted according to the cloud fraction within each grid cell. In this implementation, absorption cross sections and quantum yields are not adjusted for temperature. Differences in average photolysis rates for NO2 (left), O3O(3P) (center), and O3O(1D) (right) at ~15 km (layer 34, top); ~1600 m (layer 17, middle); and ~20 m (layer 1, bottom). For the NO2 photolysis reaction, the online method yields surface J-values which are 1-20% lower than the JPROC method at the surface. The discrepancy is less above the boundary layer, and generally within 5% at the model top. Online photolysis rates are lower at higher elevations in the West and in the Appalachians. It was determined that this behavior is due to a limitation in the current JPROC code, which does not take terrain height into account in calculating scattering from below. For the O3 O(3P) reaction,J-values from the online module are lower than JPROC, though in closer agreement than for NO2. For the O3 O(1D) reaction, online J-values are 25-40% lower at the surface than JPROC, and still 15-25% lower at the model top. This can be expected to have a significant impact on model chemistry, as shown below. 5. Conclusions and Ongoing Research 3. CMAQ 4.7 Model Configuration • It is anticipated that the online module will eventually become the generally recommended photolysis option for CMAQ. For now, however, it is to be considered a beta release. • Ongoing Research • Including temperature dependences of cross sections and quantum yields, for those photolytic reactions with available data. • Incorporating satellite data for O3 column and using satellite-observed cloud cover using the UAH method (Pour Biazar et al., 2008). • Plan to evaluate against ICARRT and/or TexAQS data. • Acknowledgements • David Wong, Sarav Arunachalam • Reference • F.S. Binkowski, S. Arunachalam, Z. Adelman, and J.P. Pinto, J. Appl. Met. Clim. 46,1252-1256, doi:10.1175/JAM2531.1, 2007. • • Meteorology computed offline with WRF 2.2 • • CB05-Cl chemical mechanism, Euler Backward Iterative (EBI) solver • Aero5 aerosol module • • 12 km (279 x 240 grid cells) domain covering eastern U.S. • • 34 vertical layers up to model top at 100 hPa • Initial and boundary conditions nested from a previous 36 km model simulation • • August 2006 simulation, with 2-day spin-up period 4. Results and Discussion Results obtained using the online photolysis module are compared with those using photolysis values interpolated from JPROC. Differences in monthly averaged photolysis rates (J-values) over daytime hours (14-24Z) are shown for three photolysis reactions at three vertical levels.