Download
1 / 20
200 likes | 289 Views
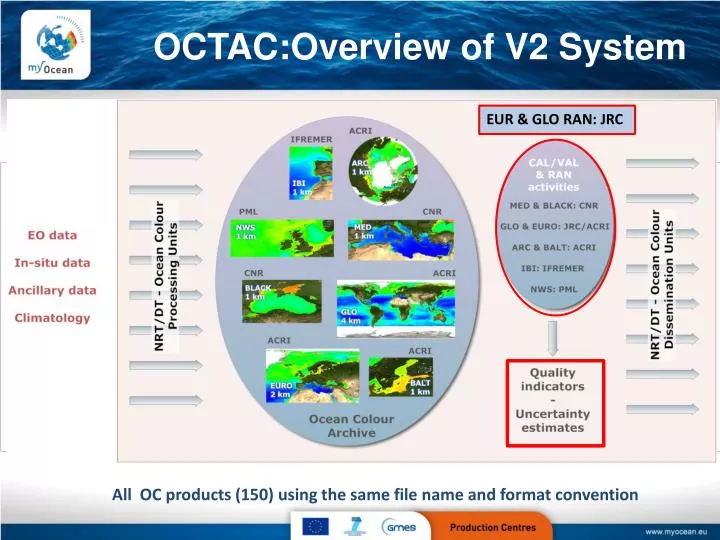
OCTAC:Overview of V2 System. EUR & GLO RAN: JRC. All OC products (150) using the same file name and format convention. OCTAC products :.

E N D
OCTAC:Overview of V2 System EUR & GLO RAN: JRC All OC products (150) using the same file name and format convention
OCTAC products: The main mission of OCTAC is to operate a European Ocean Colour Service for GMES marine applications providing global, pan-European and regional (NW Shelves, Arctic, Baltic, Mediterranean, Iberian-Biscay-Ireland (IBI) and Black Seas) high quality ocean colour products, accompanied by a suite of quality assurance items including accuracy. OCTAC products are not only used by MyOcean Forecasting Center but also directly useable by intermediate/end users (intergovernmental bodies, National Environmental Agencies, etc.) to monitor the marine state. OCTAC provides a series of products that satisfy these stakeholders’ requirements: OC productsusers are classifiedas: -> internal users -> MyOcean MFCs -> MyOcean external users : MyOcean registered users
MyOcean: GMES Marine Core Service MyOcean is delivering the ocean monitoring and forecasting component of the GMES Marine Service
MyOcean users Users in 65 different countries (25 EU members) A fair repartition in application areas And 67% of users using the core service in more than one sector
OC data assimilation in ecosystem models: Med-MFC system example MyOceanModelling Forecasting centers (GLO,ARC, BAL, NWS, IBI,MED,BS) use OC data operationaly or in re-analysis mode: to improve the ecosystem model forecasting via OC data assimilation to validate quality of the model outputs Satellite CHL data ISAC-CNR Satellite CHL data Kd data ISAC-CNR CirculationModel 1/16° INGV Biogeochemical Model OPATM-BFM 1/8° OGS CINECA Quality Control Products OGS
OC data assimilation in ecosystem models: Med-MFC system example Model output online validation April 2012 forecast Surface chlorophyll concentration (mg chl/m3) observed during March 2010 in the Gulf of Lions: satellite (top), operational forecast after assimilation of OC data (middle)
OC data assimilation: impact of satellite data on biogeochemical state variables ZOO NO3 MLD linear non-linear Impact of surface phytoplankton assimilation: standard deviation of the posterior ensemble distribution (normalised by prior ensemble standard deviation) NATL4-LOBSTER (Béal, Brasseur)
Assessment of chlorophyll in offshore areas for MSFD reporting (Cefas, UK) GMES-MyOcean-MarCOAST-MERIS-chl-2 used to calculate time and space-averaged chlorophyll for different UK sea areas Validation against chlorophyll measured in situ by moored fluorometers
Monitoring the coastal water quality The MAREL automatic station in the northern English Channel (Boulogne harbour) coastalenvironment of southern for oysterfarming. Exemple: Annual Time Series of Chl-a derivedfrom in-situ fluorescence, MERIS and MODIS October 2010-2011 In-situ mean cycle and percentile 90 are indicated on the graph
OC contributionto MSFD: MSFD’s aim is to achieve good environmental status of the EU’s marine waters by 2020. The EEA and national environmental agencies use indicators based on in-situ Chl-a trends to monitor eutrophication in the European seas In the fremework on MyOcean & Marcost a new indicator based on ocean-colour data has been proposed to monitor the eutrophycationstaus of the European and national waters Pan-European Chl a trend values (mg m-3 y-1) from Global Ocean SeaWiFS – MyOcean (left panel) and from Global Ocean GSM – MyOcean (right panel) for the period 1998-2009. Coppini et al 2012
Marine Safty: Costa Concordia accidentMyOcean and PRIMI Response
Italian PRIMI Oil-Spill Monitoring System Multi-mission: ERS, AQUA; ENVISAT, RADARSAT, COSMO/Sky-Med, TERRA … (allsatellitesproviding SST) DatiMeteo-marini Portale Utenti SAR(+ QuickLook) Dati EO PREVISIONE ARCHIVIO + I/F OTTICO Multi-source: Earth observation data and in-situ information Mail server Report Utenti Observation & Forecast Monitoring component completely connected with forecasting Satellite data Assimilation in models Integration: Information content into a GIS
Costa Concordia PRIMI oil-spill monitoring • 25 Jannary 2012: Giglio Report fromMERIS pass at 09.36. • Report sent toItalianCoastGuard. Oil-spillclassification Enhanced Image % OS detection score • smallOS detected North ofGiglio Report Costa Concordia
Costa ConcordiaMyOcean response • MyOcean – Daily forecasts of the oil spill drift and spreading from the Costa Concordia ship • Currents forecasted in the area Oil spill scenario derived locally Decision support for operations 13th Jan 2012
Costa ConcordiaThe daily forecast GMES-MyOcean-INGVBulletin The ship contains 300 Tons of oil (API 17) which are supposed to spill out in 72 hours Black is oil on the coasts
Coastal Landscape Sustains human industrial, agricultural, and economic activities around major population centers Coastal Morphodynamics Link among: human dynamics, sediment transport, physical oceanography, biochemistry, geochemistry, geology, hydrology, atmospheric dynamics, including climate change. Coastal management. Awareness of spatial patterns and associated changes; how these self-organized sandy coastlines interact with changing storm and sea-level forcing and human stabilization attempts
The Historic 2011 Mississippi River flood… a first step for coastal morphodynamics by using MODIS products (from Falcini et al 2012) Institute of Marine Remote Sensing, USF Atchafalaya Mississippi Mississippi and Atchafalaya plumes had very high SSC that could have potentially contributed to marsh accretion, BUT their contrasting hydrodynamicsled to very different depositional patterns Granted by NSF RAPID
Spatial distribution of sediment during the 2011 Flood from satellite OC data calibrated with in situ measurements a, Locations, and measured recent sediment accumulation, from shallow cores along the Delta shoreline (circles), merged with map of SSC on 1 June, 2011 derived from field-calibrated MODIS aqua data. b, Recent sediment accumulation at each sampling site. From Falcini et al 2012 submiited to Nature Geoscience
Climate & Seasonal Forecasting: biological pump Gas Transfer Velocity Chlorophyll
Satellite Primary Productivity: Mediterranean regional model Gennaio Maggio Settembre Febbraio Giugno Ottobre Marzo Luglio Novembre Aprile Agosto Dicembre • New relationship Ze -> Ctot • New relationship Ctot -> Csat • New trophic categories based on • Mediterranean chl profiles PAR Satellite INPUT DATA Chl PP MonlthlyClimatology OISST