Download
1 / 61
610 likes | 761 Views
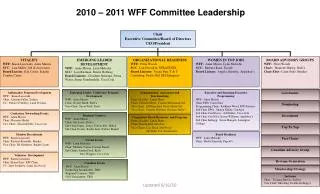
Annual Board Meeting Michael Garvey Chair, ABAG POWER Executive Committee October 19, 2000. Agenda. Structure of ABAG POWER. Executive Committee for FY 1999 - 2000. Ken Blackman, City of Santa Rosa Kathy Brown, County of Contra Costa Robert Fugle, Gold Gate Bridge District

E N D
Annual Board Meeting Michael Garvey Chair, ABAG POWER Executive Committee October 19, 2000
Executive Committeefor FY 1999 - 2000 • Ken Blackman, City of Santa Rosa • Kathy Brown, County of Contra Costa • Robert Fugle, Gold Gate Bridge District • Michael Garvey (Chair), City of San Carlos • Wayne Green, City of Salinas • Mark Lewis (Vice Chair), City of Union City • John Lisenko, City of Foster City • Alan Nadritch, City of Benicia
ABAG POWER ELECTRIC AND GAS POOL MEMBERS Special Districts/Other Agencies Golden Gate Bridge, Highway & Transportation District Regional Admin. Facility Corp. H.A.R.D. Housing Authority of County of Alameda Los Trancos Co. Water District South County Fire Authority Vallejo Sanitary & Flood Control District West County Wastewater District
ABAG POWER Electric Program • 56 jurisdictions • $52 million program • Renewable energy provider Natural Gas Program • 42 jurisdictions • $3.9 million program
Executive Committee’sDirections for Past Year Electric Program • Obtain 3% savings on energy • Improve communications with members • Increase membership by 10% Natural Gas Program • Increase savings by 2% • Increase membership by 15%
Past Year Results Electric Program • 1.4% savings on energy • Improved communications • Workshop • Member Visits • Info. memos • Membership • Lost 4 members, gained 1 Natural Gas Program • 11 % savings • (5% increase) • Membership • 3 new members • 8% increase
Future Expectations • Do not expect significant new generation until 2002. • Both gas and electric market rates to remain high through next year. • ABAG POWER: fixed-price electrical contract • PG&E attempting to recover costs of high power prices by: • Ending rate freeze prior to March 31, 2002. • Attaching surcharge to customers’ bills.
Program BenefitsFY 2000 - 01 • Energy savings • Calpine contract • Renewable rebates • Program Stability w/ fixed-price rate • Renewable Energy • Position members for fully deregulated market
Annual Board Meeting Eugene Leong President, ABAG POWER October 19, 2000
Program Overview • ABAG POWER Objectives • Aggregate power purchases --> savings • Provide economical green power option • Take control of deregulated electric future • What a Difference a Year Makes !! • April ‘98-April ‘00 --> Business as usual • June-August ‘00 --> The quarter from hell • Sept. ‘00-Dec. ‘01 --> Hedging the future
The Big Picture • “The overriding lesson of history is the need to balance market power. History shows that balance cannot be created by regulatory rules alone--it must be in the market structure…a strong consumer presence is essential to help balance the influence of suppliers and make competition work….The coalitions formed…with public power systems, rural cooperatives, municipal associations, consumer advocacy and environmental groups, and labor organizations--provide a valuable example of combined interests that might help to balance market power in both state and regional structures” • -- Scott Ridley, “Profile of Power” (1996)
“California is experiencing major problems with electricity supply and pricing caused by policies and procedures adopted over the past ten years. This summer, California has seen both electricity price volatility – exemplified by huge increases in wholesale electric prices and increases in retail prices in San Diego – and supply and delivery system instability – culminating in unprecedented black-outs in the Bay Area. These serious, but thus far isolated, examples represent a precursor of what lies ahead for California’s economy over the next 30 months. California’s reliability deficits and retail price volatility may not improve in that time without a mid-course correction.” • --PUC Report to the Governor on Utility Deregulation (Aug. 2, 2000) Executive Summary
Ongoing Challenges • Getting the “details” right • Playing ball on uneven playing field • Growing pool since size does matter (and local governments loads are small)
Future Opportunities • Demand side management and other conservation programs / services • Continuation of CEC rebates for “savings” • Strengthening aggregation or pool approach • Pursue legislative changes (?)
Summary • Current market structure results in minimum competition for retail customers, e.g. local governments • Aggregation remains viable model for local jurisdictions • Benefits to ABAG POWER members will accrue over long-term; savings likely to be modest, but real (and will hopefully grow)
Annual Board Meeting Financial Review Joe Chan October 19, 2000
Annual Board Meeting Natural Gas Program Dave Finigan October 19, 2000
ABAG POWER GAS POOL MEMBERS Special Districts/Other Agencies Golden Gate Bridge, Highway & Transportation District Regional Administration Facility Corporation Vallejo Sanitary & Flood Control District
Natural Gas Purchasing Pool • 43 local jurisdictions are members • $3.4 million total in Program Cost for FY 99-00 • In operation for 4 years • Total average savings of 6.5% for four years.
Natural Gas Program Savings • 1996-1997 7% • 1997-1998 2% • 1998-1999 6% • 1999-2000 11% • Four-year average: 6.5% • Four-year savings: $501,084
Natural Gas ProgramFY 98-99 and FY 99-00Gas Consumption • FY 98-99 6,563,076 Therms • FY 99-00 6,369,849 Therms • Difference 193,227 Therms (3%)
Natural Gas ProgramInterest Earned • $66,762: FY 99 interest earned by members • Rebates will be provided to members as a credit to November natural gas bills
Natural Gas ProgramFY 00-01 Forecast Significantly Higher Gas Commodity Prices Resulting from Increased Demand and Higher Oil Prices
Natural Gas ProgramYear 2000 ABAG Gas Purchase Prices Jan $2.484 /Dth June $4.415 Feb $2.596 July $4.945 Mar $2.628 Aug $4.395 April $3.101 Sept $6.195 May $3.003 Oct $5.885
Annual Board Meeting Electric Program Jerry Lahr October 19, 2000
Electric Aggregation Program • 56 member agencies, representing 5,300 meters • $32.5 million in total FY1999-2000 program costs • Aggregated annual load of 358,000 megawatt hours with a peak demand of 60 megawatts. • 2.5 years in operation
ABAG POWER ELECTRIC POOL MEMBERS Special Districts/Other Agencies Golden Gate Bridge, Highway & Transportation District Regional Administration Facility Corporation H.A.R.D. Housing Authority of County of Alameda Los Trancos Co. Water District South County Fire Authority West County Wastewater District
Teldata Meter Replacements • Total Accounts: 227 • 113 no replacement required • 71 replacements complete • 43 remaining installations • require cel. phone service installation • Meters use telephone connection rather than RF
Electric Program Elements Expenses • Energy • PG&E Distribution and related costs • Program Expenses • Rebate Expenses Revenues • Members’ billings • Renewable Energy Rebate
Electric Program Forecast Expense and Revenues: FY 2000-2001 Program Year
Deposits • Currently $6.1 million in member deposit to cover: • Working capital (cash flow) requirements • Credit requirements • ISO Deposits • PX Deposits • Review deposit requirements • Consider revising deposit allocation • Review potential refunds to members
Renewable Power Program • Currently receiving nearly 100% renewable power from Calpine (geothermal) • ABAG POWER participates in the CEC’s Customer Credit program • Purchase renewable energy tickets from Calpine • 1.0 cents per kilowatt rebate is shared between Calpine and ABAG POWERmembers • Public entities prohibited from participating after Dec. 2001 (AB995)
Renewable Energy Rebate • Total rebate collected for period May ‘99 - June ‘00: $1,474,636 • Feb. ‘00: $749,087 paid to members for period May ‘99 - Oct. ‘00 • Remaining rebate: $725,549 • Distribute prior to end of year
Electric Program Savings1999 - 2000 • Energy costs roughly equivalent to PG&E • Estimated 1.4% energy savings resulting from: • Reduction program expense fee from 8% to 4% • Renewable rebates
Electricity Cost Breakdown • PX Credit: amount PG&E would have incurred to purchase electricity on your behalf • PX Credit and Competitive Transition Charge (CTC) vary month-to-month, but must total to equal the generation charge