Download
1 / 16
160 likes | 292 Views
Transport Times Best Practice in Transport. TfL’s Approach to Managing Infrastructure within Climate Limits. November 2011. About Transport for London Wider Environmental Limits Spotlight on climate change Understanding the impacts and assessing the risks Plans for managing the impacts.

E N D
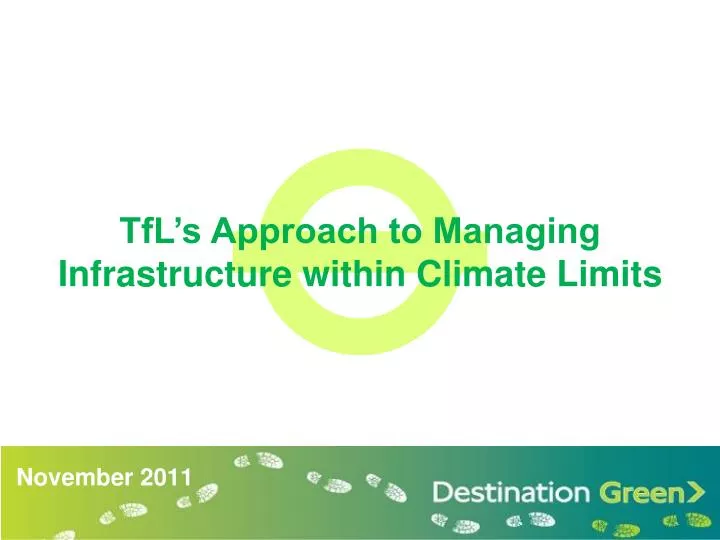
Transport TimesBest Practice in Transport TfL’s Approach to Managing Infrastructure within Climate Limits November 2011
About Transport for London Wider Environmental Limits Spotlight on climate change Understanding the impacts and assessing the risks Plans for managing the impacts
River services River services Dial-a-Ride Dial-a-Ride DLR and London Overground DLR and London Overground Transport for London Transport for London • London Underground • 3.5m trips per day • 1.1 bn passenger journeys a year • 70.5m km of services operated to 270 stations • London Underground • 3.5m trips per day • 1.1 bn passenger journeys a year • 70.5m km of services operated to 270 stations • London Buses • 8,500 buses travelling 483m km • More than 5m journeys per day • 2.2bn passengers per year • London Buses • More than 8,000 buses • More than 5m journeys per day • 2.2bn passengers per year • Traffic management • 580km of major roads • 6,000 traffic signals • Bridges and tunnels • Congestion Charging Scheme • Walking • 5.7m walk trips per day • Traffic management • 580km of major roads • 6,000 traffic signals • Bridges and tunnels • Congestion Charging Scheme • Walking • 5.7m walk trips per day • Traffic management • 580km of major roads (including bridges and tunnels) • 6,000 traffic signals • Congestion Charging Scheme • Traffic management • 580km of major roads (including bridges and tunnels) • 6,000 traffic signals • Congestion Charging Scheme Annual revenues = £3.8bn (£2.9bn from fares) Annual operating expenditure = £5.0bn £4.8m capex 2010/11 Annual revenues = £3.8bn (£2.9bn from fares) Annual operating expenditure = £5.0bn £4.8m capex 2010/11 • Cycling • 90% growth since 2000 • 0.5m trips per day • Cycling • 90% growth since 2000 • 0.5m trips per day • Taxis and PHVs • 22,000 black cabs • 44,000 licensed hire vehicles • Taxis and PHVs • 22,000 black cabs • 44,000 licensed hire vehicles
TfL’s analysis of climate change information • The UK government provided climate change projections for the country in 2009 that include a range of scenarios and confidence levels • Assets • Tracks • Drainage • Bridges • Embankments • Signals • Stations • Green estate • Surfaces – platforms, footways, pavements • Transport interchanges • And ...? • Planned build eg stations, upgrades • Services, people and customer information • Flooding • Water Resources • Overheating • Air Quality • Subsidence and heave • Wind Storms • Global climate events • Communicated by stories, backed • up by data • Eg By the 2040s, European summers like 2003 could become normal; by the 2060s they would be cool
TfL’s Climate Change Risk Analysis Workshops Communicate the climate projections Assess the impacts on services and assets Quantify and prioritize the risks Review the plans
Legal and Political Requirements reduction in CO2 in London by 2025 • The Mayor of London’s new Climate Change Adaptation Strategy The United Kingdom’s Climate Change Act of 2008 requires government agencies (including TfL) to report on how they have evaluated and planned for climate change impacts
Simple interventions where possible: • White painted roofs on buses • Industrial-sized fans on the Tube • Tube cooling represents a major challenge: • Groundwater cooling at Victoria station • Air-conditioned sub-surface trains • Testing systems for deep Tube lines Some of TfL’s Adaptation initiatives
Weather management and adaptation plans Implemented through: Emergency Plans and audits Design eg Crossrail Systems eg PAS 55 Standards eg Civil Engineering Gravity Drainage Systems Asset Management
Key findings • People and services (as well as assets) • Managing Customer Expectations: • Planned and real time information • Stakeholders: • Liaising with key employers • Organisations with interdependencies The Importance of Communication
2009: Designed into Crossrail 2020s: Upgraded deep tube lines 2011: Adaptation Report Published 2011: Updating key standards eg drainage 2012: Interdependency work 2018: Crossrail operations start 2012: Risk Assessments reviewed 2017: Victoria Station Upgrade opens 2012: Air-cooling on Circle and H&C line 2013: Air-cooling on District line Next Steps
Transport for London’s Climate Change Adaptation Programme helenwoolston@tfl.gov.uk