Download
1 / 16
160 likes | 326 Views
Section 3 Remote sensing of global change. Carbon cycle Global Change Instructor: Dr. Cheng-Chien Liu Department of Earth Sciences National Cheng Kung University Office: Building of Earth Sciences, room 30206 Voice: +886-6-2757575 ext. 65422 E-mail: ccliu88@mail.ncku.edu.tw

E N D
Section 3 Remote sensing of global change Carbon cycle Global Change Instructor: Dr. Cheng-Chien Liu Department of Earth Sciences National Cheng Kung University Office: Building of Earth Sciences, room 30206 Voice: +886-6-2757575 ext. 65422 E-mail: ccliu88@mail.ncku.edu.tw Office hours: Monday 14:00 – 17:00, Wednesday 9:00 – 12:00 URL: http://mail.ncku.edu.tw./~ccliu88/ Last updated: 5 May 2005
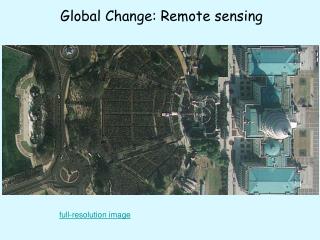
Introduction • Life on Earth carbon and water • Questions of the carbon cycle • Where does it go? • How does it get there? • What keeps the cycle moving? • What’s the future of life on Earth in a post-industrial age? • NASA’s step SeaWiFS • A short video: cycle of lifehttp://svs.gsfc.nasa.gov/stories/biosphere_20010327/package.mov
The colors of life • Color of reflected light photosynthesis utilization of carbon • Land Normalized Difference Vegetation Index (NDVI) over the past 20 years • Ocean elusive • SeaWiFS • A short video: colorful shadows: inferring carbon's cyclehttp://svs.gsfc.nasa.gov/stories/biosphere_20010327/waterplanet.mov
The carbon cycle • Observations • The carbon record • historic atmospheric carbon dioxide levels (Fig. 1) • Ice core (Fig. 2) no significant change for thousands of years • Field station (Mauna Loa, Hawaii) (Fig. 3) since 1958, once per hour annual cycle significant increase • 16.6% from 1959 – 1999 • The largest annual increase 2.9 ppmv (1997 – 1998)
Fig. 1 Fig. 1 Source: http://140.115.123.30/gis/globalc/fig/03-06.gif
Fig. 2 Fig. 2 The average levels of atmospheric carbon going back roughly a thousand years measured from ice core samples collected in AntarcticaSource: http://svs.gsfc.nasa.gov/vis/a000000/a002000/a002085/index.html
Fig. 3 Fig. 3 The average levels of atmospheric carbon measured from a field station near the Mauna Loa caldera in Hawaii since 1958 Source: http://svs.gsfc.nasa.gov/vis/a000000/a002000/a002085/index.html
The carbon cycle (cont.) • Carbon and the land – the fast cycle • Defoliation • Carbon sequestration – carbon being taken in from the surrounding world and literally trapper for a period of time by the very body that it enables to grow • Decomposition • Plant die decompose carbon is back to the environment • Fire • A short videohttp://svs.gsfc.nasa.gov/stories/biosphere_20010327/carbon_cycle_land.mov
The carbon cycle (cont.) • Carbon and the ocean – the slow cycle • Phytoplankton • Bloom • Light + nutrient photosynthesis absorb carbon in the atmosphere and grow foundation of food chain • Sources of nutrient • Deep water upwelling • River outflow • Marine snow • A short videohttp://svs.gsfc.nasa.gov/stories/biosphere_20010327/carbon_cycle_water.mov
Remote sensing techniques for studying carbon cycle • Sensor • Ocean color • Missions • Historical Satellite Ocean Color Sensors • Current Satellite Ocean Color Sensors • Scheduled Satellite Ocean Color Sensors
Table 1 SENSOR AGENCY SATELLITE OPERATINGDATES SWATH(km) RESOLUTION(m) # OFBANDS SPECTRALCOVERAGE(nm) CZCS NASA(USA) Nimbus-7(USA) 24/10/78 - 22/06/86 1556 825 6 433-12500 OCTS NASDA(Japan) ADEOS(Japan) 17/08/96 - 1/07/97 1400 700 12 402-12500 POLDER CNES(France) ADEOS(Japan) 17/08/96 - 1/07/97 2400 6 km 9 443-910 Table 1 Historical Satellite Ocean Color SensorsSource: http://www.ioccg.org/sensors/med_res.html#historical
Table 2 SENSOR AGENCY SATELLITE LAUNCHDATE SWATH(km) RESOLUTION(m) # OFBANDS SPECTRALCOVERAGE(nm) MOS DLR(Germany) IRS P3(India) 21/03/96 200 500 18 408-1600 SeaWiFS NASA(USA) OrbView-2(USA) 1/08/97 2806 1100 8 402-885 OCI NEC(Japan) ROCSAT-1(Taiwan) 27/01/99 690 825 6 433-12500 OCM ISRO(India) IRS-P4(India) 26/05/99 1420 350 8 402-885 MODIS-Terra NASA(USA) Terra(USA) 18/12/99 2330 1000 36 405-14385 MISR NASA(USA) Terra(USA) 18/12/99 360 250 4 446-867 OSMI KARI(Korea) KOMPSAT(Korea) 20/12/99 800 850 6 400-900 MERIS ESA(Europe) ENVISAT-1Europe) 1/03/02 1150 300/1200 15 412-1050 MODIS-Aqua NASA(USA) Aqua(EOS-PM1) 4/05/02 2330 1000 36 405-14385 CMODIS CNSA(China) Shen Zhou-3(China) March, 2002 - 400 34 403-12500 COCTS CNSA(China) HaiYang-1(China) 15/05/02 1400 1100 10 402-12500 CZI CNSA(China) HaiYang-1(China) 15/05/02 500 250 4 420-890 GLI NASDA(Japan) ADEOS-II(Japan) 14/12/02 1600 250/1000 36 375-12500 POLDER-2 CNES(France) ADEOS-II(Japan) 14/12/02 2400 6000 9 443-910 Table 2 Current Satellite Ocean Color SensorsSource: http://www.ioccg.org/sensors/med_res.html#current
Table 3 SENSOR AGENCY SATELLITE SCHEDULEDLAUNCH SWATH(km) RESOLUTION(m) # OFBANDS SPECTRALCOVERAGE(nm) S-GLI NASDA(Japan) ADEOS-3(Japan) 2007 1600 750 11 412-865 VIIRS U.S. Gov.(USA) NPP(USA) 2005 1700 742 19 402-11800 Table 3 Scheduled Satellite Ocean Color SensorsSource: http://www.ioccg.org/sensors/med_res.html#scheduled
Remote sensing techniques for studying carbon cycle (cont.) • Principle: • Measurements: • http://svs.gsfc.nasa.gov/vis/a000000/a002000/a002077/a002077.mpg • http://svs.gsfc.nasa.gov/vis/a000000/a000600/a000697/a000697.mpg • http://svs.gsfc.nasa.gov/vis/a000000/a002000/a002085/a002085.mpg
Remote sensing techniques for studying carbon cycle (cont.) • Useful links: • International Ocean Color Coordinate Group • Data: • GSFC Earth Sciences Distributed Active Archive Center (DAAC) http://daac.gsfc.nasa.gov/ • Ocean color http://daac.gsfc.nasa.gov/oceancolor/ • CZCS • http://daac.gsfc.nasa.gov/data/dataset/CZCS/ • OCTS • http://daac.gsfc.nasa.gov/data/dataset/OCTS/index.html • SeaWiFS • http://daac.gsfc.nasa.gov/data/dataset/SEAWIFS/ • MODIS • http://mqabi.gsfc.nasa.gov/ • http://acdisx.gsfc.nasa.gov/data/dataset/MODIS/index.html
Questions • What is the residence time for carbon to stay in various reservoirs?