Download
1 / 22
240 likes | 500 Views
Cavendish Experiment . Advanced Lab II. Josh Villatoro, Hunter Ash 2013F Seth Hodgson, Bailey Bedford, Catie Raney 2013S Darren Erdman, Mengfei Gao 2010S Amanda Baldwin, Paul Wright, Thomas Kennington, Matt Whiteway, Chris Schroeder 2009F Dan Brunski, Sung Chou,

E N D
Cavendish Experiment Advanced Lab II Josh Villatoro, Hunter Ash 2013F Seth Hodgson, Bailey Bedford, Catie Raney 2013S Darren Erdman, Mengfei Gao 2010S Amanda Baldwin, Paul Wright, Thomas Kennington, Matt Whiteway, Chris Schroeder 2009F Dan Brunski, Sung Chou, Dustin Combs, Daniel White, 2008S Susan Gosse, Daniel Freno, Jason Garman, Joshua Smith, 2007F Advisor: Dr. Johnson
Overview • Cavendish History • Theory of Measurement • Derivations • Apparatus • Procedure • Results • Constant Acceleration Method • Periodic Measurement Method • Conclusion and Sources • Error Discussion • Procedure Appendix Henry Cavendish 2
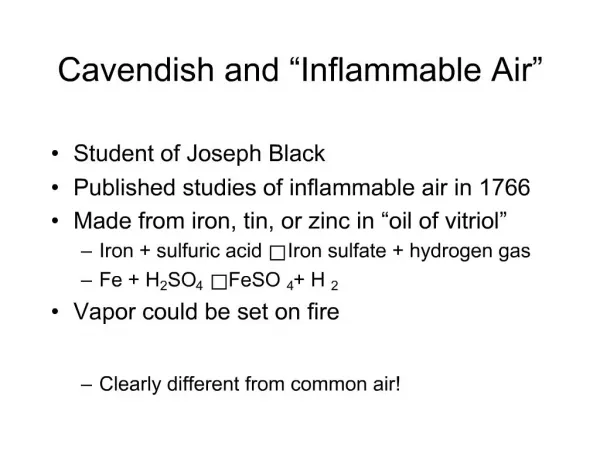
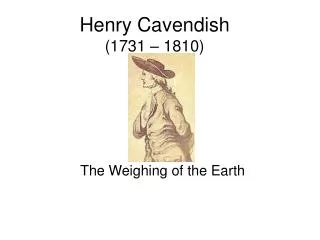
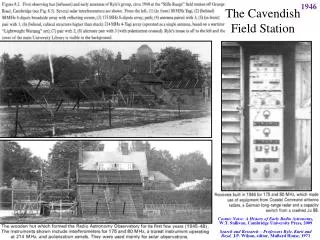
Cavendish History • Performed in 1797-1798 by Henry Cavendish • Primary result of experiment was to measure the density of the earth • “G” and the mass of the earth were derived by others after Cavendish’s death • Torsion balance method devised by John Mitchell in 1783 • Died before experiment could be performed • Apparatus passed eventually to Cavendish, who rebuilt it • The apparatus was extremely large, with the heavy lead spheres weighing upwards of 348 lbs Cavendish performed the experiment inside a closed shed and observed the result from outside through a telescope. The opening in the wall was added by the artist to show the apparatus. Vertical section drawing of Cavendish's torsion balance instrument including the building in which it was housed. The large balls were hung from a frame so they could be rotated into position next to the small balls by a pulley from outside 3
History of Measuring G Problems in Determining G • Weakest of the four fundamental forces • Inconstancy of the torsional moment of suspension • Sensitivity to environmental disturbances • Sensitive to small changes in temperature • Inability to shield gravity Consequently, G is the least precisely measured fundamental constant • The gravitational constant by Robert Kritzer March 11, 2003 4
Recent Measurements of G Peter J. Mohr and Barry N. Taylor, David B. Newell; http://physics.nist.gov/cuu/Constants/codata.pdf 5
Theory of Measurement • Two methods of measurement used • Method of equilibrium positions • Accuracy of ~5% according to PASCO • 90 to 180 min. observation time • Involves finding equilibrium points for Positions I and II by observing oscillations, then taking the difference to determine G • Method of constant acceleration • Accuracy of ~15% according to PASCO • 5 min. observation time • Uses acceleration of small masses during first minute after switching large mass positions to determine G TOP VIEW 6
Compare With Coulomb Experiment Coulomb Apparatus Diagram: Note the similarities in the experiment with the use of the torsion wire.
Constant Acceleration Derivation I • Starting with the law of gravitation: • Total force acting to accelerate: Gravityand torsion are equal and opposite Original position (in equilibrium): TOP VIEWS Gravity and torsion are in same direction Just after “flipping” large masses: • Acceleration therefore expressed as: • Solving for G yields:
Constant Acceleration Derivation II • The Law of Reflection implies that the arc length that we measure (∆S) corresponds to an angular displacement of 2θ: • Using similar triangles, we can derive a relation between the displacement of the laser dot and the linear displacement of the small masses: • Using kinematic equation of motion for constant acceleration, a0 can be calculated: b = distance between masses d = radius of torsion arm θ = angle of rotation L = distance from mirror to paper m1 and m2 = mass of objects Δs = linear displacement of small masses ΔS = displacement of laser dot • Solving for G yields:
Equilibrium Position Derivation I • Graphical Method for measuring G • Measured distance (meters) over time (seconds). • Determined period T (~ 392 s ~ 6.5 min) and displacement ∆S from data TOP VIEW • Law of gravitation given by • Attraction of masses causes torque • Torque of wire is • Combining gives • And the κθ • term is: 10
Equilibrium Position Derivation II • θcan be found from • κcan be found from • The moment of inertia is • Putting everything together yields TOP VIEW 11
Equilibrium Position Misc. • θ = angle of deflection of masses • κ= torsion constant • T = period of oscillations (~390 s, or 6.5 minutes) • b = distance between centers of large mass and small mass, 46.5 mm • d = radius of torsion arm • ΔS = separation of equilibrium positions • r = 9.55 mm, the radius of the small spheres • m1, m2 = mass of objects, m1 = 1.5 kg • L = distance from mirror to wall = 8.4 m 12
Alignment Apparatus TICO LF/PA/10 absorbs shock Alignment Make sure bob is free Center BOB over MESA Place lead ball as close as possible
Apparatus Adjustments • Set Screw: Allows rotation of knurled knob DON’T ADJUST • Knurled Knob: Adjusts the equilibrium position • DON’T ADJUST • Window-to-window separation ≈ 20° • Knob on top of Cavendish scale has tick marks • Large tick = 27.5° • Small tick = 5.5° • Equilibrium separation ~0.7° • Initial amplitude ~0.7° • Typical period 6.5 minutes 14
Apparatus Set-up Notes Screw Post TICO Knurled Knob • Isolated optical table with three-point system • Screw posts in front two holes • Lead brick under back corner • Placed TICO LF/PA/10 between supports and cabinet surface (make sure they are stable/level) • Place lead bricks on table to stabilize • Elevate cabinet by placing four lead bricks near wheels • Adjust Screw Post to center Mirror Bob over Mesa • Make sure not to bump or lean on table while centering bob • Dampen oscillations with a strong magnet held near small mass • Apply when mass already near equilibrium point • Longer you hold magnet near small mass, larger effect seen • Effect due to diamagnetic response • Total angular variation from switching mass positions ≈ 2.5° Mirror Bob
Procedure I • Set Up • Level the experiment using the threaded feet, making sure that the mirror is hanging freely in the center of the case , and center the pendulum in the middle of the mesa. • Make sure that when the large masses are moved that the small masses only experience small oscillations. • Move the large masses through the full range of motion and touch the window of the case with one or both masses if possible. Do this carefully not to cause large disturbances from hitting the glass case with the masses. Note which mass doesn’t touch. • Calibration • Using a strong magnet move the balance through the full range of motion and mark on the graph paper where the small masses touch the glass. • To center the natural equilibrium position, we would move one small tick mark. Then we would watch which direction the masses moved towards and would move it another small tick if the movement was away from the center. Initially, one could move 2 small tick marks if one was not near the center already. The angular variation in equilibrium points from switching the mass-positions was approx. 0.01 rad = 0.8º. The total angular variation from maximums was 2.5º. • Measure the distance from the mirror to the midpoint between the marks where the small masses touch the glass. • Taking Data • Move the large masses to where one is kissing the glass. This will be the starting position for the measurement. Before taking data you must wait for the small masses to come to rest. The waiting time can be reduced by slowly bringing a strong magnet near one of the small masses, thereby damping the oscillations. 16
Procedure II • Making measurements • At t=0,after the small masses have stabilized in Position I, make a mark to indicate initial position and switch the Masses to Position II • Make marks every 15 seconds, increasing the interval as needed to fit marks, and move down a row each half oscillation. Be sure to note intervals • Switch to Position I after it settles, and repeat the same process 17
Procedure III • Helpful hints • It’s helpful to record time at which it turns around • Number the bold vertical lines and use the distance from the bold line to the fine lines to measure distances easily • If two intervals overlap on the same dot, go down to the next row. Either it has passed the turn around point or your intervals are too short. • Use a timer to track overall elapsed time, and use intervals on the running time to make your marks. This is important in minimizing errors in measurements. • Calculating Equilibrium positions • Two methods: amplitude and frequency • For amplitude, take two separate averages of all marks for positions I and II, making sure there are an equal number of maxima in each direction • For frequency, average the marks closest to ¼ and ¾ the time of each period • Ideally, let it settle to the equilibrium point, and use that measurement. 18
Error Discussion I • Neither method had serious problems with error • Constant acceleration method had ≈ 15% error • Equilibrium method had ≈ 5% error • Using correction factor increases measured G by 6-9% • Possible sources of error include: • The mirror is not planar, it is concave • If mirror moves laterally, laser’s incident angle will change • If laser is not centered properly on the mirror, incident angle will not change linearly with mirror rotation • Inaccuracies in measuring the equilibrium and dot positions on the graphs • The separation of the large and small balls, b, is taken to be constant • There are modes of vibration due to movement in the room and background vibrations. • These are generally small sources of error but they can lead to inaccuracies in the position of the laser at any given time. 19
Error Discussion II • Uncertainty in the “b” value given by apparatus manual • b changed throughout experiment as arm rotated • The equilibrium points were not at the center between windows • At position 1, the equilibrium was .571 m (~3.9o) from the center position • At position 2, the equilibrium was .469 m (~3.2o) from the center position • Total change in b (window to center) in our experiment was 0.19 cm, or 0.4% of accepted value of b • Not a significant source of error 20
Sources http://en.wikipedia.org/wiki/Cavendish_experiment http://www.nhn.ou.edu/~johnson/Education/Juniorlab/Cavendish/Pasco8215.pdf http://physics.nist.gov/cuu/Constants/codata.pdf http://www.physik.uni-wuerzburg.de/~rkritzer/grav.pdf http://www.npl.washington.edu/eotwash/publications/pdf/prl85-2869.pdf 21
Mistake to Avoid • Group A’s data resulted in G=2.13*10-10, which is 320% of the accepted value • Group B’s data resulted in G=2.17*10-10, which is 330% of the accepted value Should be 5.33 x 10⁻¹¹, 80% of accepted Should be 5.43 x 10⁻¹¹, 81% of accepted Period should be calculated from time between consecutive minima or maxima, not from one minimum to next maximum as was done here minimum maximum minimum