Download
1 / 37
370 likes | 508 Views
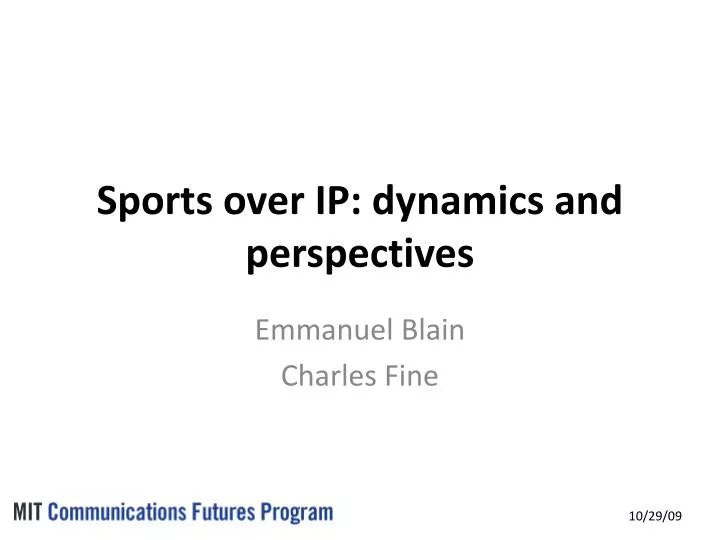
Sports over IP: dynamics and perspectives. Emmanuel Blain Charles Fine. Outline. Framework – History of sports broadcasting Problem: What happens when you go over IP ? Antitrust considerations System Dynamics model Application: Big leagues and Small leagues .

E N D
Sports over IP: dynamics and perspectives Emmanuel Blain Charles Fine
Outline • Framework – History of sports broadcasting • Problem: What happens when you go over IP ? • Antitrust considerations • System Dynamics model • Application: Big leagues and Small leagues
The delivery model for sports - 1970 SI: 1.3M readers / week $10M / year (43% of US pop) (28.7M tickets,$12.5 avg)
The delivery model for sports – MLB 1970 SI: 1.3M readers / week Salaries: ($29.3K/ player, 19% of team revenue) $10M / year (43% of US pop) (28.7M tickets,$12.5 avg) Over the Air TV: ~100% share Total TV Revenue =$10M
The delivery model for sports – MLB 1985 SI: 2.4M readers / week $136M / year Salaries: ($371K/ player, 49% of team revenue) ( 43% of US pop) (45%) (55%) (46.8M tickets,$10.5 avg) Over the Air TV: 45% Cable TV & DBS: 55% Total TV Revenue =$136M
The delivery model for sports – MLB 2005 SI: 3.1M readers/ week 250M readers/ week Salaries: ($2.9M/ player, 55% of team revenue) (0.3%) ( 43% of US pop) (10 %) (90 %) (75M tickets, $19.17avg) ($3.6 / subscriber) ($85.7 avg for 4) Over the Air TV: 10% Cable TV & DBS: 90% WebTV:~.3% Total TV Revenue =$670M
The delivery model for sports – NFL 2005 3.1M readers/ week 250M readers/ week Salaries: (59% of team revenue) (0.3%) (10 %) $100M / team (90 %) ($71.36 avg) ($3.6 / subscriber) ($107.56 avg for 4) Over the Air TV: 10% Cable TV & DBS: 90% WebTV:~.3% Total TV Revenue =$3B
The national TV channels landscape – more and more cable channels
OTA is really in a difficult situation • Cable channels now have a competitive advantage: - Dual revenue stream (ads + subscriptions)- More than 60% penetration in the U.S.- Easier to aggregate Regional Sports Networks that still benefit from high ratings • - Leagues official channels are owned by leagues: $0 broadcasting rights ! • More and more deals are cut with these channels (e.g. NFL)
Now going online… MLB example • MLB.com is the #1 online portal for baseball (well ahead of ESPN.com) • MLB.TV rebroadcasts games on a computer via Internet since 2002. The blackout and out-of-the-market policies still stands, but time-shifting is possible. • Now streaming to iPhones as well • Place-shifting
Scenario Classification • Three main “disruptive” architectures : • #1: Content is king -- Sports over IP using MLB.TV: • MLB takes control over almost the whole value chain, from content creation to aggregation/distribution • ISP as “dumb pipe” • #2: Broadcaster is king-- Sports over IP using Fancast/Versus: • ISP uses an in-house platform to gather content and customers • Customers pay for cable, get content online for free • #3: Rebroadcasting Sports over IP using justin.tv (pirate): • Justin.tv is the app and access provider • ISP as “dumb pipe”
Scenario Classification • Parallel with digital music : • #1 Content is king -- Sports over IP using MLB.TV: • Madonna contracting her tour promoter for her CD releases • #2 Broadcaster is king -- Sports over IP using Fancast / Hulu: • Warner using online platforms (iTunes) to sell mp3s • #3 Sports over IP using justin.tv (pirate): • Napster, KaZaa • Is the same sequence going to happen for Sports? Will those three models compete with each other? Is one going to prevail?
SpoIP and Antitrust • Overview of the regulation for Cable : • 1960s: the FCC did not want to regulate cable • First regulatory move : Cable Communications Policy Act of 1984 (deregulation with constraint on margins) • Re-regulation: Cable Act of 1992 • (regulation of basic rates for cable providers) • Finally, deregulation: Telecommunications Act of 1996« effective competition will keep prices down »
SpoIP and Antitrust Where is the value going ?
SpoIP and Antitrust • Overview of the regulation for Sports Broadcasting: • Sports Broadcasting Act (SBA) of 1961 • (league = single entity, allowed to act as a monopoly) • … and that’s it. • Is this really still adequate today ? • Update: • American Needle vs. NFL
SpoIP and Antitrust Market power for the leagues…
SpoIP and Antitrust • Lessons: • Regulation is broken (Sports Broadcasting Act is not relevant) • Regulators are watching broadcasters, want « effective competition. » • Back-and-forth regulatory moves make long-term projections difficult • What will be done about Web broadcasting? • For now: • Cable providers & broadcasters will have to respect net neutrality • Leagues may have to completely disintegrate content production and distribution (e.g. MLB & MLBAM) to comply with Antitrust
SD model: Methodology • Use of System Dynamics to model the market for Sports viewing and the interactions between fans, leagues, broadcasters and policymakers. • Competitive model between: • Cable TV (e.g. ESPN) • Web TV (e.g. MLB.TV) • Pirate Web TV (e.g. justin.tv)
+ + Fan Creation Rate Rabid Fan Creation Rate Potential Fans + Casual Fans (Video) Rabid Fans (Live) + League Popularity
+ + Fan Creation Rate Rabid Fan Creation Rate Potential Fans + Casual Fans (Video) Rabid Fans (Live) + League Popularity + + + Demand For Live Performances Demand For Video Content + + + Cable / Paid TV Licensed Internet Un-Licensed Internet
+ + Fan Creation Rate Rabid Fan Creation Rate Potential Fans + Casual Fans (Video) Rabid Fans (Live) + League Popularity + + + Demand For Live Performances Demand For Video Content + + + + Cable / Paid TV Licensed Internet Un-Licensed Internet + + Stadium Prices and Attendance + Team Revenue +
+ + Fan Creation Rate Rabid Fan Creation Rate Potential Fans + Casual Fans (Video) Rabid Fans (Live) + League Popularity + + + + Demand For Live Performances Demand For Video Content + Content Attractiveness + + + + + + Cable / Paid TV Licensed Internet Un-Licensed Internet + + Stadium Prices and Attendance + Team Revenue +
+ + Fan Creation Rate Rabid Fan Creation Rate Potential Fans + Casual Fans (Video) Rabid Fans (Live) + League Popularity + (Local Sports Blackouts) + + - + Demand For Live Performances Demand For Video Content + - Content Attractiveness + - + + + + + Cable / Paid TV Licensed Internet Un-Licensed Internet + + Stadium Prices and Attendance + Team Revenue +
+ + Fan Creation Rate Rabid Fan Creation Rate Potential Fans + Casual Fans (Video) Rabid Fans (Live) + League Popularity + (Local Sports Blackouts) + + - + Demand For Live Performances Demand For Video Content + - Content Attractiveness + - + + + + + Cable / Paid TV Licensed Internet Un-Licensed Internet - - + + Stadium Prices and Attendance + Team Revenue +
+ + Fan Creation Rate Rabid Fan Creation Rate Potential Fans + Casual Fans (Video) Rabid Fans (Live) + League Popularity + (Local Sports Blackouts) + + - + Demand For Live Performances Demand For Video Content + - Content Attractiveness + - + + + + + Cable / Paid TV Licensed Internet Un-Licensed Internet - - + Broadband Demand + + + Stadium Prices and Attendance + Team Revenue +
+ + Fan Creation Rate Rabid Fan Creation Rate Potential Fans + Casual Fans (Video) Rabid Fans (Live) + League Popularity + + + - + Demand For Live Performances Demand For Video Content + - Content Attractiveness + - Internet Innovation + + + + + + + Cable / Paid TV Licensed Internet Un-Licensed Internet - - + Broadband Demand + + + Stadium Prices and Attendance + Team Revenue +
+ + Fan Creation Rate Rabid Fan Creation Rate Potential Fans + Casual Fans (Video) Rabid Fans (Live) + League Popularity + + + - + Demand For Live Performances Demand For Video Content Internet Innovation + - Content Attractiveness + - + + + + + + + Cable / Paid TV Licensed Internet Un-Licensed Internet - - + Broadband Demand + + + + + Stadium Prices and Attendance + Team Revenue +
Application: Small leagues vs. Big leagues • Example of small league over IP: Sail.TV • Created in 2006 in the UK • Free Web TV, totally ad-supported. • User-generated content can be uploaded • content is available on-demand (for free for now) • Featured the 32nd America’s Cup • Very small share of online traffic.
Conclusions • SpoIP is slowly disrupting traditional Sports Broadcasting • Leagues moving down the value chain • Cablecos moving up the value chain? • Piracy threat • The legislation needs to be fixed • Sports Broadcasting Act irrelevant nowadays • Does Web broadcasting need to be regulated? How? • Different challenges and opportunities for small and big leagues
Thank you ! Any questions ?