1 / 1

Public Provider Participation in Registries, 2002

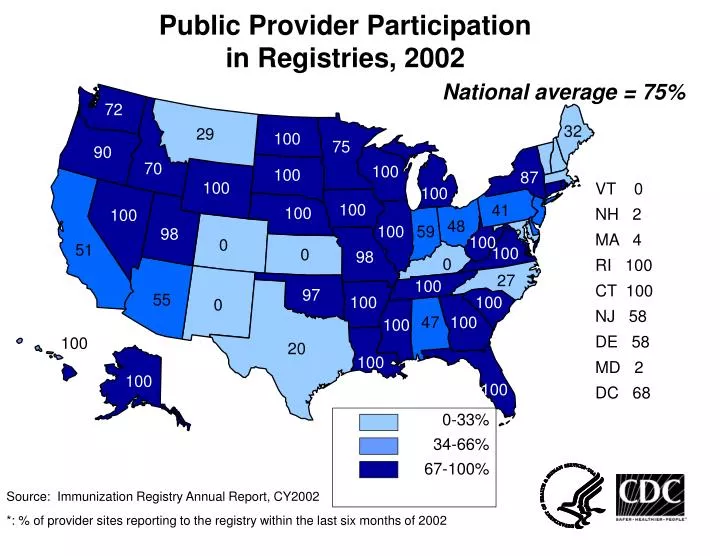
Public Provider Participation in Registries, 2002. National average = 75%. 72. 32. 29. 100. 75. 90. 70. 100. 100. 87. 100. VT 0 NH 2 MA 4 RI 100 CT 100 NJ 58 DE 58 MD 2 DC 68. 100. 100. 41. 100. 100. 48. 100. 59. 98. 100. 0. 51. 100. 0. 98.

Download Presentation

Public Provider Participation in Registries, 2002

An Image/Link below is provided (as is) to download presentation Download Policy: Content on the Website is provided to you AS IS for your information and personal use and may not be sold / licensed / shared on other websites without getting consent from its author. Content is provided to you AS IS for your information and personal use only. Download presentation by click this link. While downloading, if for some reason you are not able to download a presentation, the publisher may have deleted the file from their server. During download, if you can't get a presentation, the file might be deleted by the publisher.

E N D

Presentation Transcript


  1. Public Provider Participation in Registries, 2002 National average = 75% 72 32 29 100 75 90 70 100 100 87 100 VT 0 NH 2 MA 4 RI 100 CT 100 NJ 58 DE 58 MD 2 DC 68 100 100 41 100 100 48 100 59 98 100 0 51 100 0 98 0 27 100 97 55 100 100 0 47 100 100 100 20 100 100 100 0-33% 34-66% 67-100% Source: Immunization Registry Annual Report, CY2002 *: % of provider sites reporting to the registry within the last six months of 2002

More Related