Download
1 / 25
250 likes | 354 Views
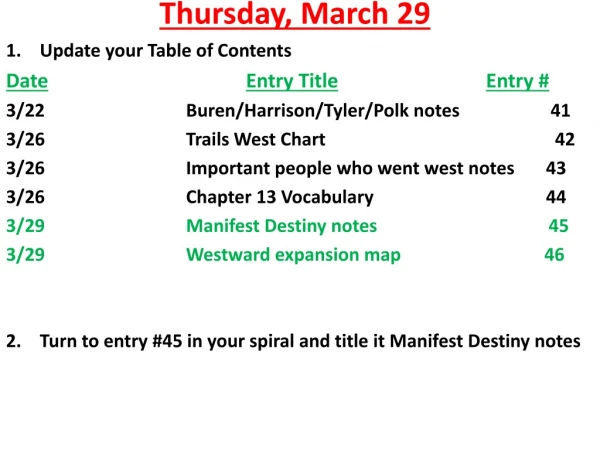
Week 9 March 29. Graphics Graphics Builder. Sales Revenue. Bar Chart. Pie Chart. Note. Slices are ordered large to small, counterclockwise. Man-Machine Interface Studies. Color improves Performance in recall Performance in a search and locate task Performance in a retention task

E N D
Week 9March 29 Graphics Graphics Builder
Pie Chart Note. Slices are ordered large to small, counterclockwise
Man-Machine Interface Studies • Color improves • Performance in recall • Performance in a search and locate task • Performance in a retention task • Comprehension of instructional materials • Performance in a decision judgment • Ability to extract information (very quickly)
Man-Machine Interface Studies • Display Format: Graphic versus tabular • Graphical display is more conducive to information recall than tabular display when the task required memory for temporal and set-integrative patterns • Recall of simple facts (e.g., point values, simple comparisons) was indifferent to variations in presentation format
Color and Decision-Maker Productivity • “If the subject’s task is to identify some feature of a target, colors can be identified more accurately than sizes, brightness, familiar geometric shapes, and other shape or form parameters, but colors are identified with less accuracy than alphanumeric symbols.”Christ, 1975
Color and Decision-Maker Productivity • “...the relative effectiveness of color is dependent upon the task of the subject. Color coding appears to be most effective when the position of the target(s) is unknown. This is particularly evident in tasks involving search over cluttered display fields. Other tasks such as target identification tend not be beneficially influenced by color coding.”Barker and Krebs, 1977
Color and Decision-Maker Productivity • “If graphics and color are to produce positive results they must be used with considerable care. There are apparently important interactions between the use of graphic/color and attributes of both the decision maker and decision task. Effective use will require more than just converting our old tabular presentations to graphics.”Ives, 1982
Human Information Processing Information capacity of a single channel is approximately seven, the number of distinguishable levels (differences) Five Visual Input Channels • Color • Relative Position • Brightness • Movement • Shape “...the human information processing system can handle considerably more inputs if those inputs are received on multiple channels.” Ives, 1982
The different images can be displayed on each display Analog images Engines LCD displays Fuel system Boeing 777 Glass Flight Deck
Engines Tanks Fuel system Boeing 777 Glass Flight Deck
Factoid 5,117 miles (9-10 hours) Tokyo (NRT) San Francisco (SFO) • Flight path transmitted and programmed into aircraft’s computer from San Francisco before the aircraft leaves Tokyo • San Francisco maintenance base continuously monitors the aircraft’s computer while in flight • The aircraft’s computer is capable of flying the aircraft (during its cruise) from origin to destination with human assistance • The aircraft’s computer is capable of landing the aircraft
Graphs • Convey information about summarized data, particularly to identify trend and proportion • Types • Pie chart • Proportion of a relative frequency to the whole • Bar graph (vertical and horizontal) • Frequency or relative frequency • Line graph • Trend
Independent and Dependent Variables • Pie charts and bar graphs • Categorical variable assigned to the independent variable • Quantitative units assigned to the dependent variable • Line graphs • Independent variable assigned to the horizontal or x axis • Must of at least ordinal scale • Dependent variable is a measurement of at least interval scale
A Few Simple Steps for Creating a Graph • Build the initial SQL command in SQL*Plus • In Graphics Builder • Build the data model • Build the graph • Select the graph type • Assign the independent and dependent to the categories and values, respectively • Format the various components of graph as needed • Save and run the graph
Initial Graph Field size too small