Download

1 / 15
150 likes | 227 Views
Section 2.4. Finding a Linear Model. Example. A company’s profit was $10 million in 2005 and has increased by $3 million per year. Let p be the profit (in millions of dollars) in the year that is t years since 2005. 1. Is there a linear relationship between t and p ?

E N D
Section 2.4 Finding a Linear Model
Example A company’s profit was $10 million in 2005 and has increased by $3 million per year. Let p be the profit (in millions of dollars) in the year that is t years since 2005. 1. Is there a linear relationship between t and p? Since the profit is a constant $3 million per year, the variables t and p are linearly related Solution Section 2.4 Slide 2 Finding a Model Finding an Equation of a Linear Model
Example Continued Find the p-intercept of a linear model Profit was $10 million in 2005 2005 is 0 years since 2005 This gives the ordered pair (0, 10) So, the p-intercept is (0, 10) 3. Find the slope of the linear model. Solution Example Continued Section 2.4 Slide 3 Finding a Model Finding an Equation of a Linear Model
Solution Rate of change of profit per year is $3 million per year So, the slope of the linear model is 3 Find an equation of the linear model. Since p-intercept is (0, 10) and slope is 3, the linear model is: Example Continued Solution Section 2.4 Slide 4 Finding a Model Finding an Equation of a Linear Model
Graphing Calculator Verify the ordered pair (0, 10) Verify that as the input increases by 1, the output increases by 3 Section 2.4 Slide 5 Finding a Model Finding an Equation of a Linear Model
Definition We perform a unit analysis of a model’s equations by determining the units of the expression on both sides of the equation. The simplified units of the expressions on both sides of the equation should be the same. Section 2.4 Slide 6 Definition: Unit Analysis Unit Analysis of a Linear Model
Example A driver fills her car’s 12-gallon gasoline tank and drives as a constant speed. The car consumes 0.04 gallon per mile. Let G be the number of gallons of gasoline remaining in the tank after she has driven d miles since filling up. 1. Is there a linear relationship between d and G? Rate of change is a constant –0.04 gallons per minute, so d and G are linearly related Solution Section 2.4 Slide 7 Finding a Model Unit Analysis of a Linear Model
Example Continued 2. Find the G-intercept of a linear model. Tank is full at 12 gallons: ordered pair (0, 12) 3. Find the slope of the linear model. Gasoline remaining in the tank with respect to distance traveled is: Solution Example Continued Solution Section 2.4 Slide 8 Finding a Model Unit Analysis of a Linear Model
Example Continued 4. Find the equation of the linear model. Since p-intercept is (0, 12) and slope is –0.04, the linear model is: 5. Perform a unit analysis of the equation Here a unit analysis on the equation : Solution Example Continued Solution Section 2.4 Slide 9 Finding a Model Unit Analysis of a Linear Model
Solution Continued We use the fact that = 1 to simplify the units of the expression on the right-hand side of the equation: Units on both sides are gallons: Suggesting correct Section 2.4 Slide 10 Finding a Model Unit Analysis of a Linear Model
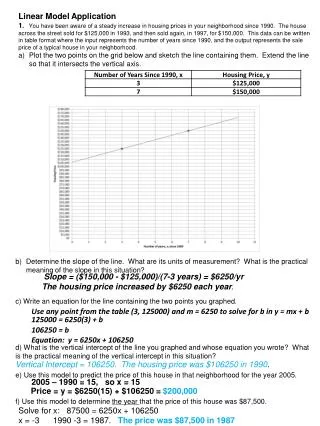
Example Yogurt sales (in billions of dollars) in the United States are shown in the table for various years. Let s be yogurt sales (in billions of dollars) in the year that is t years since 2000. A model of the situation is: 1. Use a graphing calculator to draw a scattergram and the model in the same viewing window. Check whether the line comes close to the data. Section 2.4 Slide 11 Analyzing a Model Two Variables That Are Approximately Linearly Related
Solution Draw in the same screen using a graphing calculator See Sections B.8 and B.10 2. What is the slope of the model? What does it mean in this situation? Example Continued Section 2.4 Slide 12 Analyzing a Model Two Variables That Are Approximately Linearly Related
Solution which is of the form Since m is the slope, the slope is 0.17 Sales increase by 0.17 billion dollars per year 3. Find the rates of change in sales from one year to the next. Compare the rates of change with the results in Problem 2. Example Continue Section 2.4 Slide 13 Analyzing a Model Two Variables That Are Approximately Linearly Related
Solution Rates of change are shown in the table – all are close to 0.17 Section 2.4 Slide 14 Analyzing a Model Two Variables That Are Approximately Linearly Related
Example Continue 4. Predict the sales in 2010. Substitute the input of 10 for t: If two quantities t and p are approximately linearly related, and if p depends on t, then the slope of a reasonable linear model is approximately equal to the average rate of change of p with respect to t. Solution Property Section 2.4 Slide 15 Analyzing a Model Two Variables That Are Approximately Linearly Related