Download
1 / 32
340 likes | 475 Views
Learn about Data Flow Diagrams (DFDs) as graphical representations of data flow within an information system, their symbols, types, and differences between logical and physical DFDs.

E N D
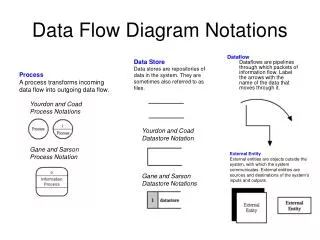
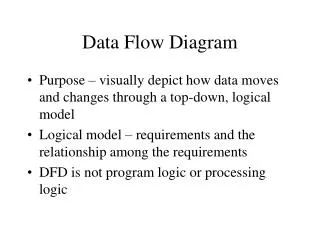
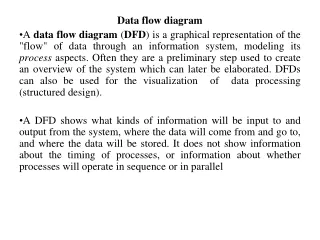
Data flow diagram A data flow diagram (DFD) is a graphical representation of the "flow" of data through an information system, modeling its process aspects. Often they are a preliminary step used to create an overview of the system which can later be elaborated. DFDs can also be used for the visualization of data processing (structured design). A DFD shows what kinds of information will be input to and output from the system, where the data will come from and go to, and where the data will be stored. It does not show information about the timing of processes, or information about whether processes will operate in sequence or in parallel
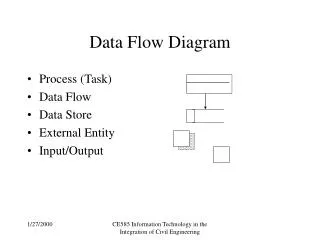
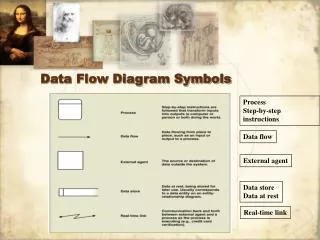
Symbols Used in Data Flow Diagram: - • Data process • A data process transforms data values. Here flow of data is transformed. E.g. Verify credits, updates inventory file. • You can make a distinction between the following types of processes:
External Entity • A source or destination of data which is external to the system. E.g supplier, customer etc.
Data store • A data store stores data passively for later access. A data store responds to requests to store and access data. It does not generate any operations. A data store allows values to be accessed in an order different from the order in which they were generated. • Input flows indicate information or operations that modify the stored data such as adding or deleting elements or changing values. Output flows indicate information retrieved from the store; this information can be an entire value or a component of a value.
Data flow • A data flow moves data between processes or between processes and data stores. As such, it represents a data value at some point within a computation and an intermediate value within a computation if the flow is internal to the diagram. This value is not changed. • The names of input and output flows can indicate their roles in the computation or the type of the value they move. Data names are preferably nouns. The name of a typical piece of data, the data aspect, is written alongside the arrow.
Physical and Logical DFDs :-- • The DFDs that show “What is going on” instead of “How it is going on” is a logical DFD. DFDs that show how things happen and which are the actual physical components involved are known as physical DFDs. Logical DFDs help to get a clear idea of what the system has to achieve without getting into details like who is going to do it? How one is going to do it? Etc. But physical models are easier to visualize. Hence analyst begins with physical DFD before converting it to logical DFD.
What is a Flow Chart? • A flow chart is a graphical or symbolic representation of a process. Each step in the process is represented by a different symbol and contains a short description of the process step. The flow chart symbols are linked together with arrows showing the process flow direction.
A flowchart for computing the factorial of N — written N! and equal to 1 × 2 × 3 × ... × N.
Use of System Flow Chart : • Communication: Flowcharts are better way of communicating the logic of a system to all concerned. • Effective analysis: With the help of flowchart, problem can be analysed in more effective way. • Proper documentation: Program flowcharts serve as a good program documentation, which is needed for various purposes. • Efficient Coding: The flowcharts act as a guide or blueprint during the systems analysis and Program development phase. • Proper Debugging: The flowchart helps in debugging process. • Efficient Program Maintenance: The maintenance of operating program becomes easy with the help of flowchart. It helps the programmer to put efforts more efficiently on that part
CASE Tools :- CASE refers alternatively to computer-aided system engineering or computer-aided software engineering. Objective of CASE tools is to automate key aspects of the entire system-development process, from beginning to end. CASE tools are essential for system analysis and it improve quality of the final result.
CASE Components :- CASE tools generally include five Components:- • Diagramming Tools • Information Repository • Interface Generators • Code Generators • Management Tools
1. Diagramming Tools: - Diagramming tools support analysis and documentation of application requirements. They include the capabilities to produce data flow diagrams, data structure diagrams, and program structure charts. • They support the capability to draw diagrams and charts, and to store the details internally. When changes must be made, the nature, of the change is described to the system, which can then redraw the entire diagram automatically.
2 Centralized information Repository: - The capture, analysis, processing, and distribution of all systems information is aided by a centralized information repository or data dictionary. The dictionary contains the details of system components, such as data items, data flows, and processes.
3 Interface Generators :- System interfaces are the means by which users interact with an application, both to enter information and data or to receive information. Interface generators provide the capability to prepare demonstration of user interfaces. Like creation of system menus, presentations screens and report layouts.
4. Code Generators :- Code generators automate the preparation of computer software. They incorporate methods that allow the conversion of system specifications into executable source code. • The best generators will produce approximately 75 percent of the source code for an application. The rest must be written by hand.
5. Management Tools: - CASE systems also help project managers in maintaining efficiency and effectiveness throughout application development process. This CASE component assists development managers in the scheduling of analysis and design activities and the allocation of resources to different project activities.
Benefits of CASE :-- The benefits of CASE technology include • Easing revision of applications • Support of system prototyping • Code Generation • Improved ability to meet user requirements • Support iterative development process.
1. Easing revision of applications :- CASE tools provide a substantial benefit to organizations by easing the burden of application revision. The central repository facilitates the revision process by providing a basis for definitions and standards for data. Internal generation capabilities, if present, also provide the means to modify the system by changing specifications rather than by adjusting the source code.
2 Support of system prototyping :- Application prototyping generally takes several forms. Sometimes screen and report designs are developed to show the organization and layout of data, headings, and messages. • Prototyping can produce a working system. Input and output features are developed along with procedural code and data files. Most CASE tools support the first prototyping form. Only a few support full prototyping.
3. Code Generation :- The most visible advantage of this feature is the reduction of time to prepare an operational program. However code generation also ensures a consistent and standard program structure and reduction of various of errors, thus improving software quality.
4. Improved ability to meet user requirements :- Having the requirements correct enhances the quality of development practices. CASE tools reduce the development time. Graphic descriptions and diagrams, as well as prototype reports and screen layouts, can bring about an effective interchange of ideas.
5. Supports Iterative Development Process :- CASE tools support iterative steps well by eliminating the manual tedium from diagramming, cataloging, and classification. As a result, it is anticipated that analysts will review and revise details more frequently and consistently.
Limitations of CASE Tools The limitations of CASE technology include • Reliance on Structured methods • Absence of Standard Levels of Methodology Support • Conflicting Use of Diagrams • Diagrams not used • Limited Function • Limited Scope • Human tasks remain Critical
1. Reliance on Structured methods :- Many CASE tools are built on a foundation of structured methodologies and the traditional system development life cycle. This single feature may be their most limiting aspect, since not all organizations use structured analysis methods. If the organization or the analyst does not use the structured analysis method and is unwilling to consider its use, the value of CASE will be reduced.
2. Absence of Standard Levels of Methodology Support:- No “standard” CASE tool set has emerged. There are two meaning to the words “ support a methodology”. A tool can (a) Support the diagrams a methodology uses or (b) It can support and enforce the methodology, its rule, and its processes. Current CASE tools have one or following characteristics: - • Are methodology independent. • Allow users to define methodologies, rules, and standards. • Support one methodology. • Support the most popular methodologies.
Methodology independent tools cannot enforce the rules and standards of a complete methodology. They may provide the components of a methodology. These tools improve productivity by performing tedious tasks and providing documentation, although they cannot ensure good system results. • Tools that provide limited methodology support can rigorously enforce the rules, procedures, and standards of the methodologies and provide contextual help, as well as knowledgebase offering expert assistance. However, the more methodologies a tool supports, the less comprehensive the assurance and assistance and assurance offered for each is likely to be.
3. Conflicting Use of Diagrams:- Tools vary in their use of diagrams. Some are essentially graphic-only tools, focusing on diagrams for input and analysis. Care must be taken when selecting a tool to support an organization’s existing methods.
4. Diagrams not used:- caseproducts generally use graphic for modeling and reporting on analysis and development throughout the system development process. One claim of automated tool vendors is that graphic presentations and documentation improve the communication among the development team members. However researchers have found that in some instances, graphic tools, whether automated or not, may not be used at all. Some analysts prefer narrative or structured English to graphics for some tasks.
5. Limited Function:- Although a tool may generally support several phases of the systems development life cycle or fit with several development methodology, its primary emphasis may be on one specific phase or method. Some products with code generation capabilities emphasize prototyping as the development method. Many back-end tools emphasize maintenance and restructuring of code but only weakly support front-end determination and specification of requirements.
6. Limited Scope:- Even though many computer-based tools include the capabilities of checking incomplete or inconsistent specifications, virtually no analysis of application requirements occurs. The scope of development activities associated with current automated tools is thus quite limited. Potential solutions to system problems are not offered or evaluated.
7. Human tasks remain Critical:- CASE technology provide tools to assist with the modeling, verification, clerical, data management, and housekeeping functions necessary to improve development productivity. The critical activities are not development of graphic charts that document the current system but rather the human-interactive tasks: requirement determination and verification with the user. As the modeling and error-checking functions of the development process are automated, the burden of information system success falls increasingly on the information requirements specifier.