Download
1 / 14
140 likes | 285 Views
Absolute luminosity determination using the vernier scan technique in the PHENIX experiment. JPS 62 nd Annual Meeting Hokkaido University, Sapporo Campus September 22, 2007 Yuji Goto, RIKEN for the PHENIX collaboration. Contents. Introduction Vernier scan (van der Meer scan) technique

E N D
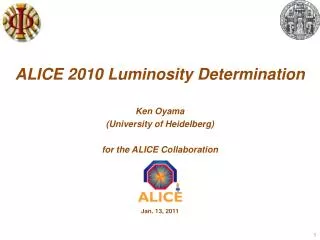
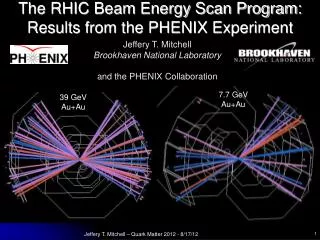
Absolute luminosity determination using the vernier scan technique in the PHENIX experiment JPS 62nd Annual Meeting Hokkaido University, Sapporo Campus September 22, 2007 Yuji Goto, RIKEN for the PHENIX collaboration
Contents • Introduction • Vernier scan (van der Meer scan) technique • Measurements at the PHENIX experiment • Data analysis • Results at s = 62.4 GeV • Summary JPS 62nd annual meeting
Introduction • Importance of absolute luminosity determination • necessary for absolute cross section measurements in proton-proton collisions • spin physics • test for the perturbative-QCD, applicability of the perturbative-QCD for asymmetry measurements • heavy-ion physics • comparison data for heavy-ion collisions • determination of the luminosity • conversion of minimum-bias trigger counts (NBBC) by BBC (Beam-Beam Counter) • conversion factor: BBC • detemination of the BBC by the vernier scan (van der Meer scan) technique • BBC minimum-bias trigger (BBCLL1): more than one hits are required on both BBC-north and BBC-south in the local level-1 (LL1) trigger logic, 30cm cut for the z-vertex JPS 62nd annual meeting
R displacement Vernier scan technique • Determination of BBC using the vernier scan technique • measuring the BBC trigger count rate (R) by displacing the collision orbit • displacement: obtained by the accelerator parameter or measurement by the BPM (Beam Position Monitor) • fitting by Gaussian + constant • width (v) and peak rate (Rmax) obtained • performed for both horizontal (H) and vertical (V) directions displacement JPS 62nd annual meeting
Vernier scan technique • Determination of BBC using the vernier scan technique • calculation of the machine luminosity (Lmachine) • fbeam: revolution frequency = 78 kHz • Nblue, Nyellow: beam intensity, obtained from the WCM (Wall Current Monitor) • calculation of BBC • vertex: z-vertex cut efficiency, obtained from the vertex distribution analysis JPS 62nd annual meeting
History • Run2 (2001-2002) • 3 measurements at s = 200 GeV • BBC = 21.8 2.1 (9.6%) mb • systematic error determined by informations from the accelerator • 3 measurements are not enough for the systematic study • Run3~(2003~) • bunch crossing-by-crossing measurements • crossing-by-crossing BBC trigger counts from the GL1P scaler • Run5~(2005~) • measurements for many fills • Run6(2006) • measurements for s = 62.4 GeV JPS 62nd annual meeting
Measurements • GL1P scaler • 4 live-time scaler for 120 bunch-crossings in the global level-1 (GL1) logic • to obtain absolute and relative luminosity in physics runs • A: BBCLL1, B: clock, C: …, D: … • BBCLL1/clock gives the BBC trigger count rate BBCLL1/clock Run4 BPM (displacement) horizontal scan (0 +) (0 ) vertical scan (0 +) (0 ) horizontal (0 +) (0 ) vertical (0 +) (0 ) Run5 Run6 JPS 62nd annual meeting
Gaussian+constant fitting peak correction WCM correction Rmax vs Lmachine good correlation no big difference in vertex Data analysis horizontal scan vertical scan Run4 Rmax Run4 Lmachine Rmax/Lmachine Run5 Run5 Run6 Run6 JPS 62nd annual meeting
z-vertex cut BBC vertex distribution (with and without z-vertex cut) bunch crossing-by-crossing BBC 17 – 19 mb significantly smaller than the Run2 result … Data analysis Run4 Run4 BBC z-vertex z-vertex bunch number Run5 Run5 Run6 Run6 JPS 62nd annual meeting
x, y x, y z z Hour-glass effect • z-position dependence of the transverse profile of the collision vertex • x,y2(z) = x,y2(0)(1+z2/*2) • *: beam focusing parameter • correction for the hour-glass effect necessary when z-width of the collision vertex big compared with * • z-width of the collision vertex 60~80 cm, *=3m in Run2, *=1m in Run3 and after (correction necessary) JPS 62nd annual meeting
Hour-glass effect • effect can be seen in z-vertex profile black: experimental data red: calculation for *=1m displacement = 0mm 0.3mm 0.6mm 0.9mm blue: calculation for *=0.5m green: calculation for *=2m JPS 62nd annual meeting
Result at s = 62.4 GeV • 13.4 mb 2.5 mb (19% systematic error) • before the hour-glass effect correction • Systematic errors • 1.9 mb: bunch-by-bunch RMS • separation of statistical and systematic errors in progress • 1.6 mb: BBC efficiency correction for the z-vertex cut efficiency • 2014% correction, detailed analysis underway • 0.5 mb: uncertainty for the displacement • correction for the hour-glass effect: 72% • 14.3 mb 2.7 mb (preliminary result) JPS 62nd annual meeting
s = 62.4 GeV での結果 • 0 cross section @ 62.4 GeV • comparison of NLO calculation NLL calculation • test of the perturbative-QCD • applicability of the perturbative-QCD for asymmetry measurements? de Florian, Vogelsang and Wagner arXiv:0708.3060 [hep-ph] JPS 62nd annual meeting
Summary • Absolute cross section measurements in proton-proton collisions at PHENIX are normalized by the vernier scan measurements • Bunch crossing-by-crossing measurements for many fills performed, data analysis underway • Data analysis at s = 200 GeV in progress • Correction for the hour-glass effect important • Preliminary result at s = 62.4 GeV obtained and applied in the 0 production cross section measurement • final result of the systematic error at s = 200 GeV to be obtained • more measurements required to obtain the systematic understanding at s = 62.4 GeV JPS 62nd annual meeting