Download

1 / 35
350 likes | 487 Views
Strategies for Estimation of Park-and-Ride Demand Constrained by Parking Lot Capacities. Luc Deneault, M.Sc. Service de la modélisation des systèmes de transport Ministère des transports du Québec. 20 th International EMME Users’ Conference October 19 th 2006 Montréal, Québec.

E N D
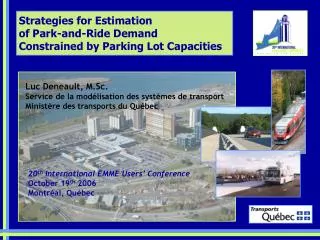
Strategies for Estimation of Park-and-Ride Demand Constrained by Parking Lot Capacities Luc Deneault, M.Sc. Service de la modélisation des systèmes de transportMinistère des transports du Québec 20th International EMME Users’ Conference October 19th 2006Montréal, Québec
Experiment conducted with the regional travel model of the Central Transportation Planning Staff (CTPS) of the Boston MPO Strategies for Estimation of Park-and-Ride Demand Constrained by Parking Lot Capacities Luc Deneault, M.Sc. Service de la modélisation des systèmes de transportMinistère des transports du Québec
Service de la modélisation des systèmes de transport • 1. Application CTPS’Commuter rail study • request by Massachusetts Bay Transit Authority (MBTA) • parking demand forecast for the 2025 AM pk period • CTPS regional travel model • area : 2 700 square miles (164 cities) • population : 4.3 M • base year model • periods : AM, mid day, PM, night • zones: 1205 (97 external zones, 122 P&R lots) • coded network:13,900 nodes, 58,500 links (17,300 walk-access)
Service de la modélisation des systèmes de transport MBTA network : Parking spaces : over 48,000
Service de la modélisation des systèmes de transport • 1999 MBTA ridership data • 1,036,100 daily boardings 122,300 commuterrail boardings • model estimate of 695,000 one-way daily passenger trips • P&R lots • base year model of 122 lots, total capacity of 45,824 spaces • very little on-street parking and most lots filled up early in the morning • 2025 network of 136 lots, capacity of 51,171spaces • demographic trends indicate that the potential demand will likely exceed capacity CTPS model • parking choice model with no explicit P&R capacitiesuses auto and transit legs impedances through matrixconvolutions
Service de la modélisation des systèmes de transport 2. Model Formulation 2.1) Parking Choice Model without Capacities (INRO) : « a little bit of greek! »
Service de la modélisation des systèmes de transport • Resolution (INRO) • auto demand (first leg of P&R trips)
Service de la modélisation des systèmes de transport • Resolution • transit demand (second leg of P&R trips)
Service de la modélisation des systèmes de transport Model Formulation 2.2) Parking Choice Model with Capacities (Spiess [1996]) :
Service de la modélisation des systèmes de transport • Model Formulation • Parking Choice Model with Capacities (Spiess) • Resolution (macro parkride): • successive coordinate descent algorithm • iteratively diverts P&R trips allocated to saturated P&R lots to alternative lots with available spaces • satisfaction of flow conservation constraints • P&R lots capacity constraints not necessarily satisfied
Service de la modélisation des systèmes de transport • Model Formulation • Parking Choice Model with Capacities (Spiess) • sum of utilities is expressed as follows : • Proposition by Hendricks, Outwater [1998] • computation of capacity-restrained impedances based on sum of utilities of the P&R mode • feedback of utilities in the mode choice step more accurate estimation of P&R demand
straigthforward Service de la modélisation des systèmes de transport Model Formulation 2.3) Shifting P&R trips in excess of parking capacities Two operations :
Service de la modélisation des systèmes de transport Removing the excess P&R trips from P&R trip matrix trips are removed from saturated P&R lots according to the proportion of trips allocated to the P&R lots by each O-D pair
Service de la modélisation des systèmes de transport Steps of the procedure
Service de la modélisation des systèmes de transport Steps of the procedure
Service de la modélisation des systèmes de transport Approach with explicit P&R Capacities
Service de la modélisation des systèmes de transport Approach with explicit P&R Capacities
Service de la modélisation des systèmes de transport 3. Implementation Initialization step : highway & walk-access (WA) skims Park-and-ride demand loop :for some strategies.. 1) mode choice step (HBW, HBO, HBSC & NHB) SOV, HOV, DA-transit, WA-transit tables 2) allocation of DA-transit (P&R) trips to PNR lots 3. Implementation Initialization step : highway & walk-access (WA) skims Park-and-ride demand step : 1) mode choice step (HBW, HBO, HBSC & NHB) SOV, HOV, DA-transit, WA-transit tables 2) allocation of DA-transit (P&R) trips to PNR lots Auto leg of DA-transit => SOV demandtransit leg of DA-transit => WA-transit • Parking choice step applied twice : • first, to compute skims for mode choice • then to allocate the DA-transit trips
Service de la modélisation des systèmes de transport • Implementation within CTPS model • Issues • Strategies of allocation of P&R trips • Characterization of P&R trips (mode choice step) • Calibration issues • Development of emme/2 macros
Service de la modélisation des systèmes de transport • 3.1 Strategies of Allocation of P&R Trips • Implementation of 6 different strategies ofskimming/allocation compared to each other (AM peak period, year 2000) • logit without capacity constraints • option (1) with reallocation of exceeding trips; • logit with utilities relative to capacities (no constraint) • option (3) with reallocation of exceeding trips; • logit with explicit capacity constraint; • option (5) with reallocation of exceeding trips.
Service de la modélisation des systèmes de transport Computational efforts Strategies with P&R lots capacities are more computationally demanding
Service de la modélisation des systèmes de transport • Computational efforts • Strategies 5 and 6 implemented as an iterative process • for each iteration: • new skims submitted to the mode choice step • generation of a new P&R trip demand matrix • shifts of trips exceeding P&R lot capacities • convolutions successively applied to each P&R lot zone: • to determine the O-D pairs of the trips using each lot • and remove the % of demand in excess of capacity
Service de la modélisation des systèmes de transport • 3.2 Characterization of P&R trips • Guidelines and assumptions to characterize P&R tripsand applied as constraints in the mode choice step ( the Greater Vancouver Regional District (GVRD) ; Edwin Hull Associates [1998]) • Assumptions for the MBTA Commuter Rail Study: • DA-transit leg time<4 X auto impedance(for O-D pairs where auto impedance (time) > 10 minutes) • [in-vehicle time of DA-transit leg > 0] && [out-of-vehicle time of DA-transit leg < 5 X in-vehicle time of DA-transit leg] • transit leg weighted impedance < 1.5 X (WA-transit total weighted transit impedance) • auto leg times<1.5 X (total auto times)
Service de la modélisation des systèmes de transport • 3.3 Calibration issues • Two objectives: • Good fit of P&R lot counts (“reliable” P&R trips) • quick convergence of solution of the problem
Service de la modélisation des systèmes de transport Running the parkridemacro Strategies adapted to a context of saturated P&R lots : The number of iterations within parkride : parkride decreases the attractivity of saturated P&R lots.. P&R trips diverted to P&R lots with available spaces. Trip demand allocated to P&R lots may equal or violate P&R lot capacities.. a relatively high number of iterations within parkride will increase the probability of a "feasible" solution.
Service de la modélisation des systèmes de transport • Running the parkride macro • The number of iterations within parkride : • Computing skims for the mode choice procedure.. • high number : will divert more and more trips to the "less" attractive P&R lots; implemented as such, parkride would generate relatively high skims values for the P&R mode and mode choice step would result in a lower number of P&R trips • low number : will generate a solution closer to that of “unconstrained” strategy, and therefore produces lower skims values for the P&R mode, which results in an higher number of P&R trips • high number of iterations of parkride in the skimming step to obtain the most “realistic” P&R skims
Service de la modélisation des systèmes de transport • 3.4 Development of emme/2 macros pnr.mac :runs the logit intermediate destination choice model without explicit capacities • computations of skims and allocations of P&R trips, essentially applies the implementation of Blain[1994] and INRO (emme/2 User's Manual) • addition of convolution steps to remove trips that exceed the PNR lot capacities • Parking choice model with explicit capacities: • pnrskim.mac : computes P&R skims derived from the results of the parkride macro (using convolutions steps already presented by Spiess [1996]) • postride.mac : implements the strategy that removes exceeding P&R trips
Service de la modélisation des systèmes de transport 4. Results
Service de la modélisation des systèmes de transport Results
Service de la modélisation des systèmes de transport Results
Service de la modélisation des systèmes de transport • MTQ modeling activities (urban level) • MTQ involved in preparation and management of regional O-D surveys (avg. sample rate of5%)periodic surveys : interval of 5 years for the Montréal region • Development and maintenance of transportationmodels for the Montréal, Québec City, Sherbrookeand Trois-Rivières regions:modeling strategy:expansion of O-D survey data,person and auto assignment models, trip forecasting model, mode transfer model, vehicle emissions model • Participation in the development and maintenance of the Ottawa-Gatineau region transportation model: classical four-step model developed and operated by the TRANS Committee
Service de la modélisation des systèmes de transport Park-and-ride Statistics MTQ models
Service de la modélisation des systèmes de transport • MTQ’s P&R modelling opportunities • Montréal region-P&R lots of regional bus lines - extension of existing commuter rail lines and eventual new commuter rail lines (AMT) - eventual light rail studies (AMT) • Québec City region-light rail (“tramway”) study (RTC) • Ottawa-Gatineau region-Projet Rapibus (STO, Gatineau) - O-train (OC Transpo, Ottawa) - transitway (OC Transpo, Ottawa)
Service de la modélisation des systèmes de transport • Conclusion • The proposed strategy: • combines the parking choice model implemented in the parkride macro with the strict satisfaction of parking lot capacities • forecasting tool : allows to incorporate the magnitude of planned expansions at P&R lots and capture their impacts at the neighboring stations and throughout the transit system • a by-product : several emme/2 macros
Luc Deneault: (514) 864-1754 Luc.Deneault@mtq.gouv.qc.ca Thank you ! Merci ! Acknowledgements :