Download
1 / 29
300 likes | 417 Views
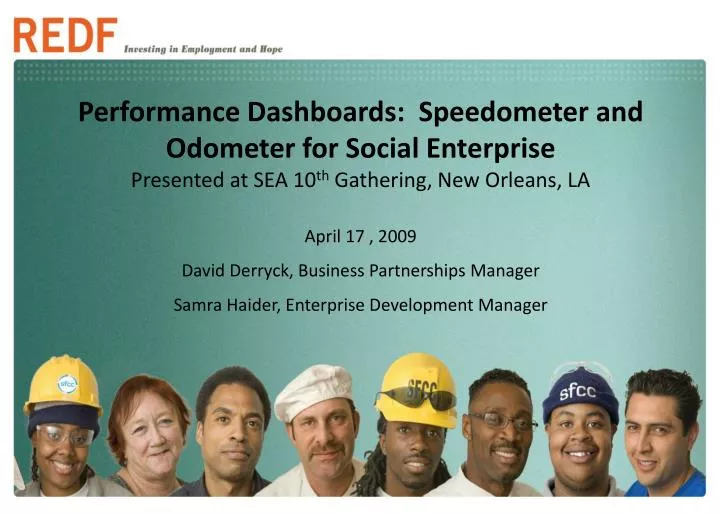
Performance Dashboards: Speedometer and Odometer for Social Enterprise Presented at SEA 10 th Gathering, New Orleans, LA. April 17 , 2009 David Derryck, Business Partnerships Manager Samra Haider, Enterprise Development Manager. About REDF.

E N D
Performance Dashboards: Speedometer and Odometer for Social EnterprisePresented at SEA 10th Gathering, New Orleans, LA April 17 , 2009 David Derryck, Business Partnerships Manager Samra Haider, Enterprise Development Manager
About REDF REDF creates job opportunities and pathways to employment for people with the greatest barriers to work REDF is a high engagement grantmaker that invests in and provides guidance to a portfolio of nonprofit social enterprises. We help solve issues of poverty and homelessness by helping well run nonprofit businesses (social enterprises) and for-profits provide job opportunities To strengthen the field, we share learning with business, philanthropy, non-profits and government, and cultivate networks of people and institutions that create lasting change
Agenda for session Item Timing 20 minutes 30 minutes 20 minutes 20 minutes Description • Presentation of the basics of performance dashboards: • What are dashboards and why are they useful? • How are nonprofit and for-profit dashboards different? • Who looks at a dashboard? • Discuss best (and worst) practices for dashboards • Break into groups of 3 to 5 • Each group acts as a different stakeholder and brainstorms the key metrics they would include in a dashboard • Several groups present a summary of their discussions • We highlight the metrics most useful for each stakeholder • Provide a review of different options for creating dashboards • Debrief learnings as a group and answer questions Introduction Breakout session Review of metrics and best practices Wrap-up and questions
What is a dashboard? • Performance dashboards display key performance indicators (KPIs) which are critical metrics that directly impact performance Like a car dashboard, a performance dashboard is a real-time snapshot of performance that: • Shows only the most important indicators via simple charts, graphs, gauges, maps and tables • Should be assessed against budgets and other performance targets • Optimizes decisions, enhances efficiency and accelerates bottom-line results
What a dashboard is not! • A dashboard is not: • A balance sheet or monthly sales/expense reports: it is not a static, or canned report generated on a regular basis • A text heavy document: it should no requires a significant amount of time to review • An Annual Report: it is not a comprehensive report addressing all aspects of the organization • An individual performance management tool
What does the output look like? • Revenue Dashboard
What does the output look like? • Revenue Dashboard
What does the output look like? • Fundraising/ Development Dashboard
What does the output look like? • Marketing Dashboard
What does the output look like? • Accounting Dashboard
What does the output look like? • Program Dashboard
How is a social enterprise dashboard different from a for-profit dashboard? • Nonprofits and social enterprises capture financial and operational indicators, similar to for-profits… • …but they also need to track social indictors that show how successful they are in achieving the organization’s mission • Similar to a for-profit, choosing the right operational metrics is important for a social enterprise… • …but the most critical operational metrics might be different based on the capacity issues and cost/ revenue structures of social enterprises • There will be mission-related tradeoffs! • Setting the right financial, operational, and social goals that will be tracked using a dashboard will require the organization to be aligned around these priorities
Who are the key stakeholders? Stakeholders vary across the organization and so can the type of information they want to analyze from the dashboard
Who should develop KPIs? • The process for developing an organization’s KPIs will directly impact their utility with regards to usage and implementation. The are several factors to consider, the most important of which is organizational size Large Functional Teams design • Other factors to consider • Organizational culture • Staff size • Internal capabilities • Staff Structure Organization Size Management Team designs Medium Executive Director designs Small
Identify data needs KPI Development Process Repeat and refine as necessary Inventory current performance measurement tools Define KPIs Produce KPIs and review with management Build into management processes Set Initial Targets • Decide upon process for data collection for routine reviewing of KPIs • Review with management to gain endorsement; refine as required • Set aggressive but achievable targets • Define acceptable control limits • Identify external benchmarks and compare performance to best practices • Inventory current performance targets • Develop initial thoughts on key profit drivers and desired social outcomes to measure • Use small, select groups to develop first-pass KPIs • Identify key business and social drivers • Define KPIs • Define data needs and sources for KPIs • Develop plan to close data gap if necessary • Develop historical time series for KPIs • Establish infrastructure to deliver KPIs routinely (i.e. dashboard) • Incorporate into routine practices and core management processes Repeat process for each team/group/business line
Agenda for session Item Description • Presentation of the basics of performance dashboards: • What are dashboards and why are they useful? • How are nonprofit and for-profit dashboards different? • Who looks at a dashboard? • Discuss best (and worst) practices for dashboards • Break into groups of 3 to 5 • Each group acts as a different stakeholder and brainstorms the key metrics they would include in a dashboard • Several groups present a summary of their discussions • We highlight the metrics most useful for each stakeholder • Provide a review of different options for creating dashboards • Debrief learnings as a group and answer questions Timing 20 minutes 30 minutes 20 minutes 20 minutes Introduction Breakout session Review of metrics and best practices Wrap-up and questions
What is the criteria for your metrics? Criteria • Measurable • Able to be measured accurately and in a timely fashion • Understandable • Clear and simple • Specific • Specific to the person/team accountable • Able to be influenced by the person/team accountable within appropriate timeframe • Controllable • Central to the mission/activity goals and the person/team responsible • Meaningful • Important • Significant driver of site performance
Top 5 mistakes to avoid when creating a dashboard • Do not have too many indicators: Limit to a subset of truly key indicators. The dashboard needs to be short and easy to understand in order for everyone to review it and act on it regularly • Do not make updating of data too cumbersome: If it is too onerous to keep producing the dashboards on a regular basis, the organization will stop doing so • Do not choose only historical charts: The dashboard should provide information that can guide managers in making future decisions; be strategic in the way you analyze data • Do not assume a dashboard will tell you everything you need to know: An organization still needs to use insight and analysis to determine what is driving dashboard metrics and what to do about it • Do not assume that everyone in the organization has the know-how to use dashboards
Case Study: Electronic Waste Recycling Business • Organizational Mission • To provide transitional employment to very low income individuals. • Program • Each participant takes part in a structured 3-month training program addressing: Work attitude; responsibility; communication; problem solving, preparing for the workplace • Enterprise • A certified electronic waste collector, the enterprise leverages its church parish network to collect a wide range of electronics to generate income and provide job training to the disadvantaged. It collects electronic equipment such as tvs, CPUs, monitors, and cell phones. It earns revenue by selling these items to recyclers that pay different rates based on the type of equipment.
Breakout Instructions • Break into groups of 3-5 • Each group is designated to act as a stakeholder • Brainstorm the key metrics to include in a dashboard from the stakeholders’ perspective • Prioritize the most important 3-5 metrics
Agenda for session Item Description • Presentation of the basics of performance dashboards: • What are dashboards and why are they useful? • How are nonprofit and for-profit dashboards different? • Who looks at a dashboard? • Discuss best (and worst) practices for dashboards • Break into groups of 3 to 5 • Each group acts as a different stakeholder and brainstorms the key metrics they would include in a dashboard • Several groups present a summary of their discussions • We highlight the metrics most useful for each stakeholder • Provide a review of different options for creating dashboards • Debrief learnings as a group and answer questions Timing 20 minutes 30 minutes 20 minutes 20 minutes Introduction Breakout session Review of metrics and best practices Wrap-up and questions
Key metrics: Organization • Revenue (Actual vs. Budget) • Earned Income, Grants, Fundraising, Enterprise • Costs (Actual vs. Budget) • Admin, Program, Enterprise, Fundraising • # of jobs created • # of people employed
Key metrics: Enterprise Enterprise metrics will vary based on what type of social enterprise you are running • YTD actual costs and revenues vs. budgeted • Revenue by product line • Gross margin • Costs by product line • Lbs diverted from landfill by product type
Key metrics: Programs Social metrics will alsovary based on what is the mission of the organization • # of people served (actual vs. planned) • # of people that complete pre-employment training program • # of interactions with program staff • Cost per participant
REDF observations Social enterprise staff need to drive the development of KPIs in order to understand why it is important to track them Operational management and decision-making significantly improves when the dashboard is regularly used Dashboards are a tool and not a solution • But, no matter how useful the management team feels the dashboard is, if it takes too much time to update the dashboard, it will stop being used!
What dashboard interface is right for you? There is no perfect option for choosing the right application for your dashboard. Managers need to consider a variety of factors in deciding on what application to choose Potential dashboard offerings
Checklist: Is this the right dashboard? DashboardChecklist Do any of my current software platforms have the appropriate dashboard capabilities? If not, would my current software be compatible with a dashboard? How long will it take to fully implement? How much time will be required to manage the data in the dashboard? Is it automated and easy to update? Will the dashboard provide real-time data? Have we come up with the right KPIs to track on the dashboard? Do the right managers know what they are supposed to look at on the dashboard and why? Does someone in the organization “own” the dashboards i.e. a Dashboard Manager
Agenda for session Item Description • Presentation of the basics of performance dashboards: • What are dashboards and why are they useful? • How are nonprofit and for-profit dashboards different? • Who looks at a dashboard? • Discuss best (and worst) practices for dashboards • Break into groups of 3 to 5 • Each group acts as a different stakeholder and brainstorms the key metrics they would include in a dashboard • Several groups present a summary of their discussions • We highlight the metrics most useful for each stakeholder • Provide a review of different options for creating dashboards • Debrief learnings as a group and answer questions Timing 20 minutes 30 minutes 20 minutes 20 minutes Introduction Breakout session Review of metrics and best practices Wrap-up and questions
About today’s presenters David Derryck Business Partnerships Manager REDF (www.redf.org) dderryck@redf.org Samra Haider Enterprise Development Manager REDF (www.redf.org) shaider@redf.org David Derryck is REDF’s Business Partnerships Manager. He is leading the For Profit Jobs Program, developing a set of tools and linkages for REDF Portfolio organizations’ social enterprise “graduates” to successfully move into private sector employment. He is also providing hands-on business assistance to select REDF Portfolio organizations.Prior to joining REDF, David spent three years as the Enterprise Director of Juma Ventures. At Juma, he led the development and subsequent national expansion of its social enterprise where he more than doubled revenue and tripled the number of jobs for youth from 80 to over 250. David has also worked in international trade co-founding a website to automate export trade documentation and spent three years as an analyst in private equity. He received his MBA from Columbia Business School and BA from Wesleyan University. Samra Haider is REDF’s Enterprise Development Manager. She manages business assistance projects with specific portfolio organizations and the pipeline by providing hands-on assistance, such as market research and financial analysis, as well as business mentoring. Additionally, she supports REDF’s portfolio pipeline development, Farber Program, and field advancement.Prior to joining REDF, Samra was a Consultant with Oliver Wyman (formerly Mercer Management Consulting). She also worked as an Investment Banking Analyst for JPMorgan Chase and was a Farber Intern in 2007. Samra holds a BA in Economics from Columbia University, an MSc in Human Rights from the London School of Economics, and an MBA from the Wharton School.