Download
1 / 52
530 likes | 679 Views
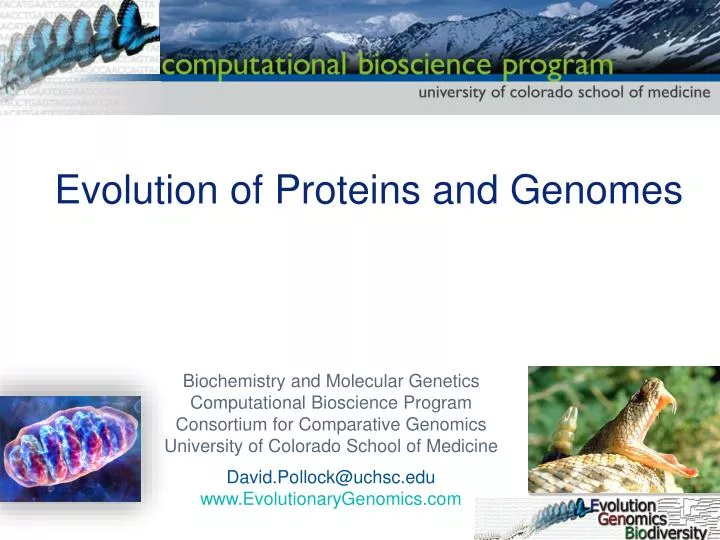
Evolution of Proteins and Genomes. Evolution of Proteins. Jason de Koning. Description. Focus on protein structure, sequence, and functional evolution Subjects structural comparison and prediction, biochemical adaptation, evolution of protein complexes,

E N D
Evolution of Proteins Jason de Koning
Description • Focus on protein structure, sequence, and functional evolution • Subjects • structural comparison and prediction, biochemical adaptation, evolution of protein complexes, • probabilistic methods for detecting patterns of sequence evolution, effects of population structure on protein evolution, • lattice and other computational models of protein evolution, protein folding and energetics, • mutagenesis experiments, directed evolution, coevolutionary interactions within and between proteins, and • detection of adaptation, diversifying selection and functional divergence.
Structural and Functional StudiesExperimental (NMR, X-tallography…)Computational (structure prediction…)
Mouse: …TLSPGLKIVSNPL… Rat: …TLTPGLKLVSDTL… Baboon: …TVSPGLRIVSDGV… Chimp: …TISPGLVIVSENL... Mouse: …TLSPGLKIVSNPL… Rat: …TLTPGLKLVSDTL… Baboon: …TVSPGLRIVSDGV… Chimp: …TISPGLVIVSENL... Conserved proline Conserved proline Variable “High entropy” Comparative Sequence AnalysisLooking at sets of sequences A common but wrong assumption: sequences are a random sample from the set of all possible sequences Mouse: …TLSPGLKIVSNPL… Rat: …TLTPGLKLVSDTL… Baboon: …TVSPGLRIVSDGV… Chimp: …TISPGLVIVSENL...
Comparative Sequence AnalysisLooking at sets of sequences In reality, proteins are related by evolutionary process
SF PT …TLFKRNPL… …TLSKRNTL… …TLSKRNT… …TLFKRNP… …TLSKRNT… …TLFKRNP… …TLSKRNT… …TLFKRNP… Confounding Effect of Evolution …TLSKRNPL…
SF PT …TLFKRNPL… …TLSKRNTL… …TLSKRNT… …TLFKRNP… …TLSKRNT… …TLFKRNP… …TLSKRNT… …TLFKRNP… Confounding Effect of Evolution …TLSKRNPL… Everytime there is an F, there is aP! Everytime there is an S, there is a T!
Ways to Deal with This… Most common: Ignorance is Bliss Some: Try to estimate the extent of the confounding (Mirny, Atchley) Remove the confounding (Maxygen) Include evolution explicitly in the model (Goldstein, Pollock, Goldman, Thorne, …)
Stochastic Realizations Fitness Selection Selective Pressure Mouse: …TLSPGLKIVSNPL… Rat: …TLTPGLKLVSDTL… Baboon: …TVSPGLRIVSDGV… Chimp: …TISPGLVIVSENL... Stability Folding A B Function C
Data Understanding Model Selective Pressure Mouse: …TLSPGLKIVSNPL… Rat: …TLTPGLKLVSDTL… Baboon: …TVSPGLRIVSDGV… Chimp: …TISPGLVIVSENL... Stability Folding A B Function C
Purines Pyrimidines DNA
Replication Translation Folding Function mRNA Protein Protein DNA What does DNA do?
Selective Pressure
Substitution Insertion Deletion …UGUAUAAAG… …UGUAAAAG… …UGUUACAAAG… Genetic changes …UGUACAAAG…
Substitutions Can Be: Transitions Purines: A G Pyrimidines: C T Transversions
Substitutions in coding regions can be: CysArgLys UGU/AGA/AAG Silent Nonsense Missense UGU/CGA/AAG UGU/GGA/AAG UGU/UGA/AAG CysArgLys CysGlyLys CysSTOPLys First position: 4% of all changes silent Second position: no changes silent Third position: 70% of all changes silent (wobble position)
Homologous crossover Uneven crossover leading to gene deletion and duplication Gene conversion
Keep on doing whatever it originally was doing Lose ability to do anything (become a pseudogene) Learn to do something new (neofunctionalization) Split old functions among new genes (subfunctionalization) Fate of a duplicated gene
Gene duplication a Hemoglobin b Hemoglobin Speciation Mouse a Hb Rat a Hb Mouse b Hb Rat b Hb Paralogs Orthologs Homologies
Selection Differences in fitness (capacity for fertile offspring) 1 gene 2 alleles (variations), A and B 3 genotypes (diploid organism): AA, AB, BB GenotypeFitness AA ωAA = 1 (wild type) AB ωAB = 1 + SAB BB ωBB = 1 + SBB S > 0 advantageous S < 0 unfavorable S ~ 0 neutral
Evolution of Gene Frequencies q = frequency of B p = (1-q) = frequency of A , , population: differential equation for p, q q(next generation) pq[psAB + q(sBB-sAB)] = q(this generation) + p2 + 2pq(sAB+1) + q2(sBB+1)
Fixation of an AdvantageousRecessive Allele (s=0.01) Genotype Fitness Value Frequency of B AA 1.0 AB 1.0 (recessive) BB 1.01 Generation
Equilibration of an Overdominant Allele Frequency of B Genotype Fitness Value AA 1.0 AB 1.02 BB 1.01 Generation
1-e-2s Probability of fixation = 1-e-2Ns 1 N = 10 10-02 N = 100 = 2s (large, positive S, large N) 10-04 N = 1000 10-06 Fixation probability = 1/(2N) when |s| < 1/(2N) 10-08 10-10 N = 10,000 10-12 10-14 -0.01 0 0.01 0.02 Selective advantage (s)
Human vs. Rodent Comparison Highest substitution rates pseudogenes introns 3’ flanking (not transcribed to mature mRNA) 4-fold degenerate sites Intermediate substitution rates 5’ flanking (contains promoter) 3’, 5’ untranslated (transcribed to mRNA) 2-fold degenerate sites Lowest substitution rates Nondegenerate sites The Rate of Evolution Depends on Constraints
Human versus Chimpanzee Mouse Opossum Pufferfish Size (Gbp) 3.0 2.5 4.2 0.4 Time since divergence ~5 MYA ~ 65 MYA ~150 MYA ~450 MYA Sequence conservation (in coding regions) >99% ~80% ~70-75% ~65% Aids identification of… Recently changed sequences and genomic rearrangements Both coding and non-coding sequences Both coding and non-coding sequences Primarily coding sequences Selection of Species for DNA comparisons
UCSC Genome Browser
Comparative analysis of multi-species sequences from targeted genomic regions Nature, 2003
Comparative Genomics in the CFTR Region • Near CFTR • 1.8 Mb of human Ch7, Sequenced for 12 ssp. • How does a region change over evolutionary time? • How much does it change? • What types of changes are more/less common? • Do some lineages have more of certain changes than others? • How much comparative genomic data do we need???
Looking backward from the human genome How much is still there after 450my (Fugu)
Transposable ElementsGone Wild! BovB CR1
Nucleotide Changes Big insertions/deletions are more common than nucleotide changes! In primates, large indels are the principal mechanism accounting for observed sequence differences
Identifying Functionally Important RegionsHow many comparative genomes do we need?Can’t we just use the mouse? Using 12 species, 561 Multi-Species Conserved Sequences (MCSs) were found How can be found using just the Mouse genome (rather than all 12) False Pos. True Pos. False Neg.