Download
1 / 44
440 likes | 550 Views
Variations in Muon Flux: Four Years from Dallas Regionals to SNO Lab. Thomas A. Catanach 3 August 2009. Introduction.

E N D
Variations in Muon Flux:Four Years from Dallas Regionals to SNO Lab Thomas A. Catanach 3 August 2009
Introduction • Cosmic rays, subatomic particles or nuclei, fly through space at close to the speed of light with very high energies and collide with the earth’s atmosphere triggering a cascade of particles which creates muons. • The flux of muons varies over time due to a variety of environmental and solar factors, many of which exhibit periodicity. • Over the past four years I have explored these periodic variations beginning with the Dallas Regional Science Fair with a detector made at SMU and continuing with my involvement with Project GRAND and SNO Lab.
Categories of cosmic rays Solar cosmic rays Galactic cosmic rays Extragalactic cosmic rays. Cosmic rays are made of 90% protons (p+), 9% alpha-particles ( α2+), and 1% heaver nuclei or electrons (e-). Cosmic rays interact with the magnetic field of the galaxy and the solar system. Cosmic Rays
Muons • The muon is in the second generation of the lepton family • Mass: 106 MeV/c2 • Charge: -1 • Lifetime at rest: 2.2 µsec • Cosmic rays hit the atmosphere creating a cascade of particles at about 15km in the atmosphere. • Underground, muons can be produced by neutrinos • On average 1 event occurs per cm2 per minute. http://livefromcern.web.cern.ch/livefromcern/antimatter /history/historypictures/cosmic-80.jpg
Muon Detection • Plastic Scintillator detectors • Uses a PMT to detect scintillation light from muons entering the plastic • Proportional Wire Chamber (PWC) • Similar to Geiger-Muller detectors • A gas filled chambers with large potential differences. • Heavy Water Chambers • Cherenkov light from the muons can be detected by a ball of PMTs so tracks can be constructed through the D2O. http://research.fit.edu/hep/Cosmic_Ray_Muon_Detection.pdf
Fourier Analysis • Discrete Fourier Transform • Converts a series in time domain into a series in the frequency domain • Power Spectral Density (PSD) • The spectra of the power at each frequency in frequency space for the function • Sliding Fourier Transform … FFT n+2 n+1 n n+3 4 n+2 n+1 3 2 1
Science Fair • Using a Plastic Scintillator Detector I conducted muon flux measurements for three years during High School • Objectives: • Research sensor bias • Correlate different samples in order to isolate probable trends • Determine the affect of climate on muon flux
Selection of Data *This data was collected by SMU and was divided into several files causing the data to be discontinuous at several points.
Detector Correlation Low Frequency Trends Areas of High Correlation Filter Width
Power Spectral Density 1 Cycle Per Day Trend Relative Intensity (dB) Relative Intensity (dB) 2 Cycle Per Day Trend
Pressure PSD 1 Cycle Per Day Trend 2 Cycle Per Day Trend
Precipitation Decrease In Flux Before Rain Stabilizes After Rain Increase In Flux During Rain
Discussion • Observations • Minor sensor bias • Correlations did exist between the samples revealing possible low frequency trends along with a one and two cycle per day trend • Climatic factors particularly pressure have an appreciable influence on muon flux • Lessons • Datasets are never pretty which requires the development of different approaches to tackle the problems • Understanding sensor bias • Finding methods to fuse data • Computing skill are essential for any level of research • Mentors and networks were very important to so that I could discuss my ideas and problems
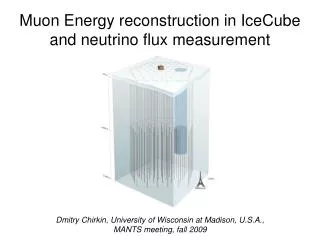
Project GRAND • Project GRAND uses proportional wire chambers (PWC) to detect muons to find individual events and showers. • The flux of muons varies over time due to a variety of environmental and solar factors, many of which exhibit periodicity. • Through Project GRAND large continuous datasets can be used to isolate these trends • Objectives: • Analyze the effects of temperature and pressure on muon flux and identify seasonal trends so that a calibration factor can be determined. • Research the character of the daily mean variation in muon flux
Low Energy Experiment 30 – 300 GeV Single Track Muon Data Looks for variations in individual muon flux due to solar phenomena such as a Solar Energetic Proton High Energy Experiment 100-100000 TeV Shower Data Analyze high energy cosmic ray events Project Grand Setup 8x8 array of PWCs with total area of 83 m2 Muon threshold of .1 GeV ±63o cutoff angle from zenith with ±.26o precision Project GRAND Experiments
Hut Construction • 8 Proportional Wire Chambers • 4 x-planes (NS) • 4 y-planes (EW) • Chamber Details • Each plane has 80 cells • .01 m separation high voltage plates • 1.25 m2 in area • Uses 80% Argon 20% CO2 gas mixture • .05 m steel plate before the bottom two planes • Hut temperature and humidity are held within normal levels .014 m .2 m .05 m 1.1 m
Muon and Shower Detection • Muon Detection • For coincidence the planes must register an interaction within 400 nano seconds • These interactions must form a straight path within the detector • There is a 4% chance that an e will be miss identified as a muon • There is a 4% chance a muon will be miss identified as an e • Shower • Several (>3) huts must show a track within 400 ns • This path does not have the same restrictions as a muon path as many more interactive particles could be produced by a shower
July 2007 - January 2008 • Statistically corrected data set using a good hut vector
Histogram Method • Binned Muon flux over 170 Days • Exhibits a 1 and 2 cycle/day component
Power Spectral Density • Power Spectrum of the first 110 Days • Peaks around 1 and 2 cycles per day • Periodicity possibly due to the Interplanetary Magnetic Field • Pressure correction further uncovers the peaks especially the 2 cycle per day Pressure Corrected Muon Flux PSD Muon Flux PSD
1 and 2 cycle per day • A 8192 element Fourier Transform was slid over the 171 day data set • Significant seasonal variations are observed • 1 cycler per day variation initially increases plateaus then decrease in mid November • 2 cycle shows significant increase into December then decreases Days Since September 12 Days Since September12
Discussion • Observations • Pressure has an observable influence on muon flux and tests yield a correction factor around 1 • Other climatic factors make pinning down this value difficult • Seasonal variations in flux can be observed • These seasonal variations influence the DMV changing the phase and amplitude of the 1 and 2 cycle per day trends • Lessons • Working on a research project reveals all the work that goes into modern science from engineering and physics to manual labor, but this allows you to truly understand the project. • Developing skills working with data analysis software really helped to advance my research
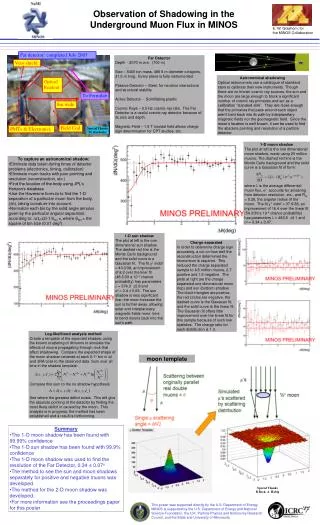
SNO Lab • The Sudbury Neutrino Observatory uses a very large sphere of heavy water with 9600 PMTs to detect particles traveling 2 km underground. It was designed to look for neutrino oscillation in solar neutrinos. • The muon dataset was reconstructed by Joseph Formaggio at MIT using a variety of criteria to separate muons from other particles • nhits must be greater than 250 • Reconstruct tracks • Objectives • Study variations in High Energy Cosmic Rays >3 TeV • Look for the shadowing effects of the moon and sun
Complete Dataset Sky Map Declination Right Ascension
Nhits Distributions eta <.125π .4375 π <eta <.5625π .625 π <eta <.75π .875 π <eta
Eta Distribution Events Eta (radians)
Psi Distribution Events Psi (radians)
Solar Analysis Declination Right Ascension
Time of Day Exposure Seconds Exposure Seconds Time of Day (Seconds in Julian Time)
Daily Variation Normalized Intensity Time of Day
Discussion • Observations • Shadowing effects were not able to be observed probably because of inadequate data • The observed daily variation in muon flux appears significantly higher than anticipated • Seasonal variations were observed in both the high energy muons and induced muons • Lessons • Working on a large collaboration like SNO has provide me an excellent opportunity to grow and experience true physics research • My research projects have been cumulative allowing me to use my past experiences to help face the unique challenges of each project