Download
1 / 8
80 likes | 177 Views
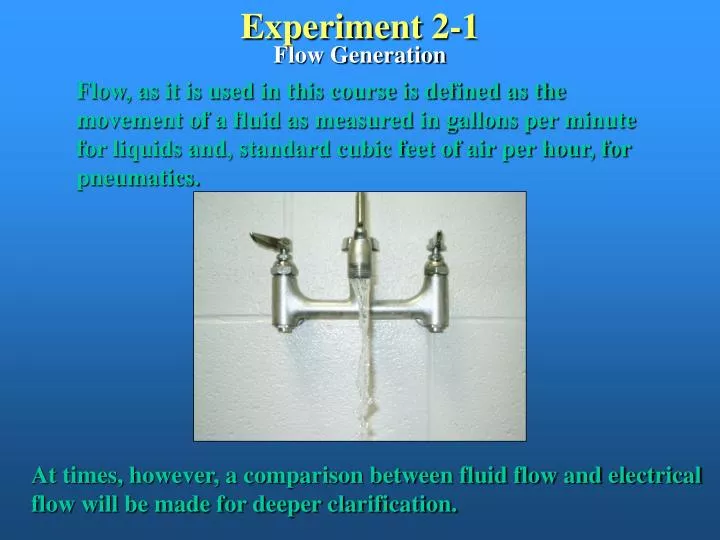
Experiment 2-1. Flow Generation. Flow, as it is used in this course is defined as the movement of a fluid as measured in gallons per minute for liquids and, standard cubic feet of air per hour, for pneumatics.

E N D
Experiment 2-1 Flow Generation Flow, as it is used in this course is defined as the movement of a fluid as measured in gallons per minute for liquids and, standard cubic feet of air per hour, for pneumatics. At times, however, a comparison between fluid flow and electrical flow will be made for deeper clarification.
Flow Generation Objectives: 1. Describe how flow is generated in a fluid power system. 2. Describe how pressure is generated in a fluid power system 3. Measure the volumetric flow from a hydraulic pump using a bucket and stopwatch. 4. Measure the volumetric flow from a pump using a flow meter. 5. Calculate the average fluid velocity inside a fluid conductor.
Flow Generation Flow is generated by a hydraulic pump or a pneumatic compressor. Flow is created when an imbalance exists between two points and, as with electrons, the fluid takes the path of least resistance. In hydraulics, the pump forces the oil to leave its outlet as a result of a pressure differential, however, this does not generate pressure. Resistance to flow in any magnitude results in pressure. You will learn that resistance comes from many different sources within a fluid power system.
Measuring Flow Rate Since hydraulic pumps are positive displacement devices, flow should be constant at its outlet provided that the speed at which the pump is driven, and pressure at the outlet, remain constant. We will use a device called a flow meter to measure flow.
Our flow meter has two scales, one in GPM, and the other, in LPM. The meter can register flows from 0 to 5 GPM, 2.5 being the midrange. The direction of flow is from the bottom through the top. In practice, there exists a certain amount of error with the flow meter as there is with most measuring devices. There will sometime be a need for accuracy and the degree of total accuracy for the scale may be desired. In this experiment you will examine the accuracy of this flow meter.
Measuring Flow Rate Another method of determining flow rate is the use of a bucket and stop watch. Simply use a bucket with appropriate markings and time the quantity captured in one minute. This is especially useful for determining flow from any source.
Review 1. What device is used to generate fluid flow in a hydraulic system? 2. What causes pressure in a fluid power system? 3. Name two methods of measuring the flow rate of a hydraulic system. 4. In the circuit of the experiment part I, step 3, what is the flow reading of the flow meter when the relief valve is closed? 5. In the circuit of the experiment Part I, what is the flow reading of the flow meter when the needle valve is closed? If your answer is different from your answer for question 4, explain why. 6. Using your experimental data from Part II, step 7, calculate the actual flow rate for each flow meter reading. Use the following formula. Fill in the chart on page 11. 7. Using your data from question 6, calculate the error in the flow meter reading for the following flow rates: 2.5 gpm 0.5 gpm
8. From your calculations in question 7, was the flow meter error greater at the higher flow rate or lesser flow rate? Explain why. 9. In the experiment Part III, what effect did the pressure at the pump have on the pump’s flow rate? Explain your answer. 10. In the experiment Part I, step 10, how was the flow rater decreased?