Download
1 / 8
80 likes | 234 Views
Supplementary Figure 1. . A. B. Supplementary Figure 1. L1 and Alu retrotransposition assay. A. Schematic of L1 retrotransposition plasmid (L1). ORF1 and ORF2 indicate open reading frames 1 and 2 encoded by the full-length L1. A white interrupted arrow corresponds to the neomycin

E N D
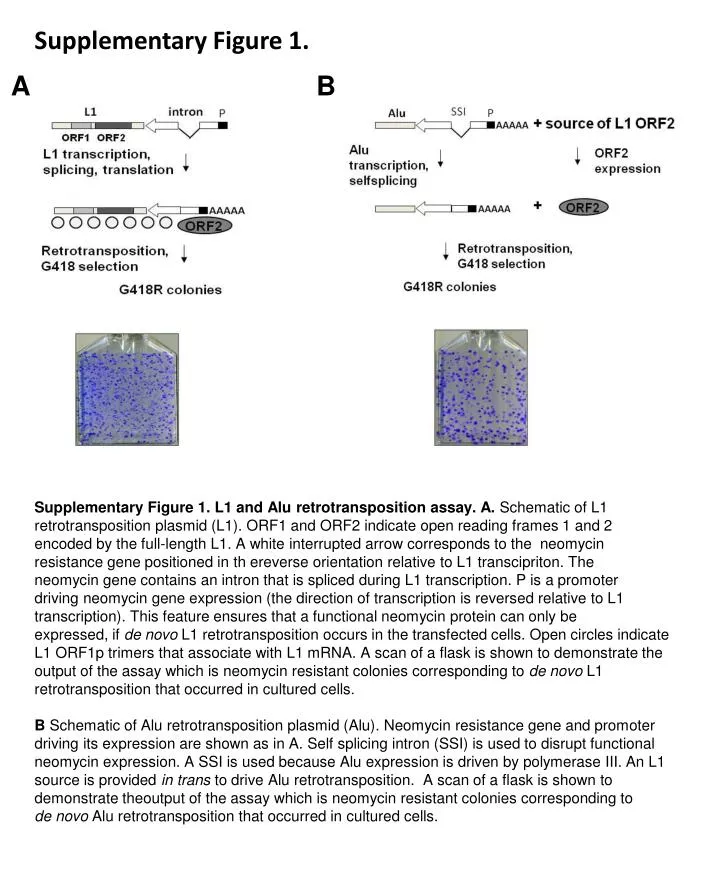
Supplementary Figure 1. A B Supplementary Figure 1. L1 and Aluretrotransposition assay. A. Schematic of L1 retrotransposition plasmid (L1). ORF1 and ORF2 indicate open reading frames 1 and 2 encoded by the full-length L1. A white interrupted arrow corresponds to the neomycin resistance gene positioned in thereverse orientation relative to L1 transcipriton. The neomycin gene contains an intron that is spliced during L1 transcription. P is a promoter driving neomycin gene expression (the direction of transcription is reversed relative to L1 transcription). This feature ensures that a functional neomycin protein can only be expressed, if de novo L1 retrotransposition occurs in the transfected cells. Open circles indicate L1 ORF1p trimers that associate with L1 mRNA. A scan of a flask is shown to demonstrate the output of the assay which is neomycin resistant colonies corresponding to de novo L1 retrotransposition that occurred in cultured cells. BSchematic of Aluretrotransposition plasmid (Alu). Neomycin resistance gene and promoter driving its expression are shown as in A. Self splicing intron (SSI) is used to disrupt functional neomycin expression. A SSI is used because Alu expression is driven by polymerase III. An L1 source is provided in trans to drive Aluretrotransposition. A scan of a flask is shown to demonstrate theoutput of the assay which is neomycin resistant colonies corresponding to de novo Aluretrotransposition that occurred in cultured cells.
Supplementary Figure 2. Supplementary Figure 2. Toxicity is a colony formation assay in mammalian cells transiently cotransfected with a neomycin expression plasmid (pNeo) and with a L1 or MT1 expression plasmids and/or an empty expression plasmid to measure any potential effects of L1 and/or MT1 overexpression on cell viability and colony formation. G418 selection results in selection of cells acquired randomly integrated pNeo plasmid. In contrast to the L1 and Aluretrotransposition assay described in the Supplementary Figure 1, these NeoR colonies do not depend on de novo retrotransposition.
Supplementary Figure 3. A B Supplementary Figure 3.MT1 effect on Aluretrotransposition is specificto MT1 function. Luzindole treatments were performed as described in 2A. A L1-driven Aluretrotransposition in the presence of the control plasmid is not affected by melatonin receptor antagonist (left panel top row and right panel grey bars), but it is increased when the treatment is combined with MT1 overexpression (left panel bottom row and right panel black bars). BLuzindole treatments and cotransfection of L1 with MT1 expression plasmid do not affect cell viability and colony formation in Hela cells. Colony numbers obtained for retrotransposition and toxicity without any treatment with melatonin receptor antagonist are set as 100%. Error bars are standard deviation; asterisks indicate statistically significant differences by ttest.
Supplementary Figure 4. actin Supplementary Figure 4.L1 mRNA stability in HeLa and NIH 3T3 cells. Hela and NIH 3T3 cells transiently transfected with an L1 expression plasmid were treated 24 hours posttransfection with 75 ug/ml of Actinomycin D for 2, 4, and 8h. Collected RNA was analyzed by northern blot with a strand-specific RNA probe complementary to the 0-97bp region of the L1 5’UTR as described. Numbers below images represent average (N=2) amount of the full-length L1 mRNA for each time point relative to the untreated control (0h).FL1 is full-length L1 mRNA.
Supplementary Figure 5 Supplementary figure 5. Melatonin receptor 1 overexpression suppresses L1 ORF1p in immortalized human fibroblasts. Western blot analysis of lysates from immortalized human fibroblasts (GM04429, Coriell) transiently transfected with L1 expression plasmids and with or without MT1 expression plasmid (labeled MT1 and control, respectively). Very low ORF1p signal is detected when the L1 expression plasmid is co-transfected with the MT1 expression plasmid in three independent experiments.
Supplementary Figure 6 L1 retrotransposition, BlastR or NeoR colonies,% CMV/DL1Blast DCMV/L1Neo Supplementary figure 6. Melatonin receptor 1 overexpression suppresses L1 retrotransposition regardless of the promoter. Hela cells transiently transfected with L1 expression plasmids and with or without MT1 expression plasmid. CMV/DL1Blast is an L1 expression plasmid driven by the CMV promoter. This plasmid does not contain an L1 5’UTR harboring L1 promoter. The L1 is tagged with a blasticidin resistance gene (blast). DCMV/L1Neo is an L1 expression plasmid driven by the L1 promoter located within the L1 5’UTR. This plasmid does not contain the CMV promoter. The L1 in this expression plasmid is tagged with a neomycin resistance gene (Neo). MT1 overexpression significantly reduces L1 retrotransposition driven by either the CMV or L1 promoters. Error bars are standard deviation.
Supplementary Figure 7. A B Supplementary figure 7. A.Aluretrotrotranspositionsupported by DCMVL1 (without a tag) in the presence and absence of MT1 expression. Treatment with luzindole overcomes the suppressive effect MT1 on Aluretrotransposition in a dose-dependent manner. Error bars are standard deviation. B. Toxicity assay in Hela cells transfected with DCMVL1 and empty or MT1 expression plasmids and treated with increasing amounts of melatonin receptor antagonist luzindole (0, 10-7, 10-6, or 10-5 M). Error bars are standard deviation; no statistically significant differences was detected by the ttest.
Supplementary Figure 8 A B C Supplementary figure 8. L1 mRNA expression is regulated by melatonin in human tissue- Isolated xenograft model of prostate cancer in nude rats. A. Schematic representation of L1 and primers used for RT-PCR. B. Validation of primer specificity. Results of PCR amplification using rat (Rn) or human (Hs) DNA as template. NC is negative control, M is marker. C. Detection of L1 mRNA by RT-PCR in DNA samples collected from the prostate xenograftsperfusedin situ as described in figure 1. RT is reverse transcriptase, L1 and actin are L1- and actin-specific primers, PC3 is RNA from PC3 cells used to generate xenograft tumours. M is marker, NC isnegative control.