Download

1 / 21
210 likes | 383 Views
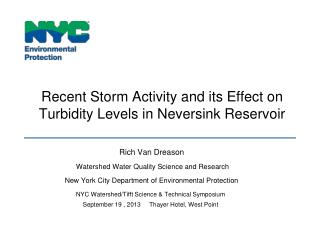
A Probabilistic Model for Turbidity and Temperature in the Schoharie Reservoir Withdrawal. Steven W. Effler and Rakesh K. Gelda Upstate Freshwater Institute, Syracuse, NY Donald C. Pierson New York City Department of Environmental Protection. 2009 Watershed Science & Technical Conference

E N D
A Probabilistic Model for Turbidity and Temperature in the Schoharie Reservoir Withdrawal Steven W. Effler and Rakesh K. Gelda Upstate Freshwater Institute, Syracuse, NY Donald C. Pierson New York City Department of Environmental Protection 2009 Watershed Science & Technical Conference September 14th-15th, Thayer Hotel, West Point, New York
Schoharie ReservoirWater Supply Withdrawal and Esopus Creek • water quality issues for withdrawal • temperature (T) • turbidity (Tn) withdrawal depth when full = 18 m Shandaken Tunnel ~ 29 km Esopus Creek Ashokan Reservoir
Variations in Water Quality of Withdrawal and Thresholds of Concern • threshold: 21.1 °C • drivers of variability: • meteorology • reservoir drawdown • threshold: ~ 15 NTU • drivers of variability: • runoff • reservoir drawdown • meteorology related management modeling goal for Schoharie Reservoir: develop and implement a modeling strategy to represent this variability in model applications
Development of Modeling Strategy • a “probabilistic” framework is desired to represent variability • long-term records of environmental and operational drivers (model inputs), together with tested water quality models, offer opportunity to represent variability • these historic conditions are inherently representative of the system
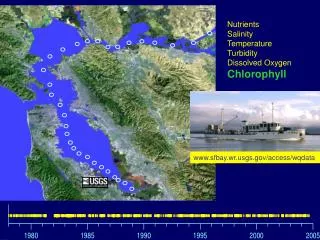
Design of Probabilistic Model Framework for Schoharie Reservoir Stream Temperature (empirical model) Stream Turbidity Loading (empirical model) Stream Flow (USGS) Reservoir Operations (NYC DEP) • Water Quality Model • transport/hydrothermal sub model • turbidity submodel with resuspension Met. Data (NOAA) MLI Optimization Algorithm Wave Model Withdrawal Temperature and Turbidity long-term records independent emp. models multi-level opt. algo.
Water Quality Model (W2Tn) • transport/hydrothermal submodel (W2/T) • mechanistic, dynamic, two-dimensional from CE-QUAL-W2 (USACE)see Gelda and Effler 2007. J. Environ. Eng. Sci. 6:73-84 • turbidity submodel • three particle sizes of turbidity • sources – external loads (primarily Scoharie Creek), resuspension (circulation and wave-driven) • sinks – export and settlingsee Gelda and Effler 2007. J. Environ. Eng. Div. ASCE133:139-148
Water Quality Model (W2Tn) Segmentation and a Simulation intake
Independent Empirical Models to Specify Inputs for Probabilistic Model Stream temperature (plunging) Ts,i = a0 + a1 Tair,i-3 + a2 log (Qi) • long-term stream T predicted from Tair and Q records Turbidity-Flow Relationship (external loads) Tn = 2.5 C660 - long-term stream Tn loads predicted from Q records
Performance of Probabilistic Model in Representing Variability of Withdrawal T • observations: 1987-2004 • prediction bounds: for driving conditions of 1987-2004 • probabilistic model succeeds in representing range of observations
Performance of Probabilistic Model in Representing Variability of Withdrawal Turbidity • observations: 1987-2004 • prediction bounds: for driving conditions of 1987-2004 • probabilistic model succeeds in representing range of observations
Performance of Probabilistic Model in Simulating Water Quality in the Withdrawal generally good performance
Example Application of the Probabilistic Model: Scenario Description • potential benefits of multi-level intakes (MLI) and location in the reservoir • is there a benefit to “spatial avoidance” of turbid plumes?
Projections for MLI Scenario with Probabilistic Model: Site 3 versus Site 1.5 • for 57 years of historic conditions • summary statistic of number of days withdrawal Tn > 15 NTU, for individual years of record Schoharie Cr. - no noteworthy benefit for MLI at site 1.5 versus site 3
Projections for MLI Scenarios with Probabilistic Model, Comparisons to existing Withdrawal Case • for 57 years of historic conditions • cumulative distribution format for presentation of results - modest benefit of MLI; exceedences decrease from 27 to 16% of days
Summary • probabilistic modeling framework for temperature and turbidity for Schoharie Reservoir developed, tested and preliminarily applied • key components: tested mechanistic water quality models, long-term records for drivers, and empirical models • insights from preliminary applications concerning multi-level intake alternatives • broad utility of approach • other issues and systems (Ashokan, Kensico) • flexibility to accept upgrades/updates • coupling with hydrologic model (OASIS) • to integrate water quantity needs of overall system
Related Professional Journal Citation • a more complete treatment of material addressed in this presentation can be found in the following peer-reviewed journal paper Gelda, R. K. and S. W. Effler, 2008. Probabilistic model for temperature and turbidity in a reservoir withdrawal. Lake and Reserv. Manage. 24: 219-230.
Investigation of Model and Input Updates/Upgrades (2009) • turbidity submodel and stream turbidity loading model
Investigation of Model and Input Updates/Upgrades (2009) • turbidity submodel and stream turbidity loading model • Updates based on • new particle characterizations (Peng et al. 2009) • resuspension studies (Cornell) and modeling (Owens et al. 2009) • expansion of model testing for additional years of detailed monitoring (Owens et al. 2009) • correction of coding error for resuspension based on additional stream monitoring data
Effects of Updates/Upgrades on Probabilistic Model Projections • an example Schoharie Cr. • management perspectives on MLI/location alternatives remain unchanged
Summary • probabilistic modeling framework for temperature and turbidity for Schoharie Reservoir developed, tested and preliminarily applied • key components: tested mechanistic water quality models, long-term records for drivers, and empirical models • insights from preliminary applications concerning multi-level intake alternatives • broad utility of approach • other issues and systems (Ashokan, Kensico) • flexibility to accept upgrades/updates • coupling with hydrologic model (OASIS) • to integrate water quantity needs of overall system